
There are a number of airborne geophysical methods used within the minerals exploration industry. Some of the most commonly used ones are aeromagnetics, radiometrics and VTEM. A digital elevation model or DEM is often done as an addition to most airborne geophysical surveys. Gravity surveys can also be conducted from the air as well as from the ground.
Any unusually high or low region in the data that cannot be explained by the known geology is called an anomaly. Geophysics can create models that explain most anomalies.
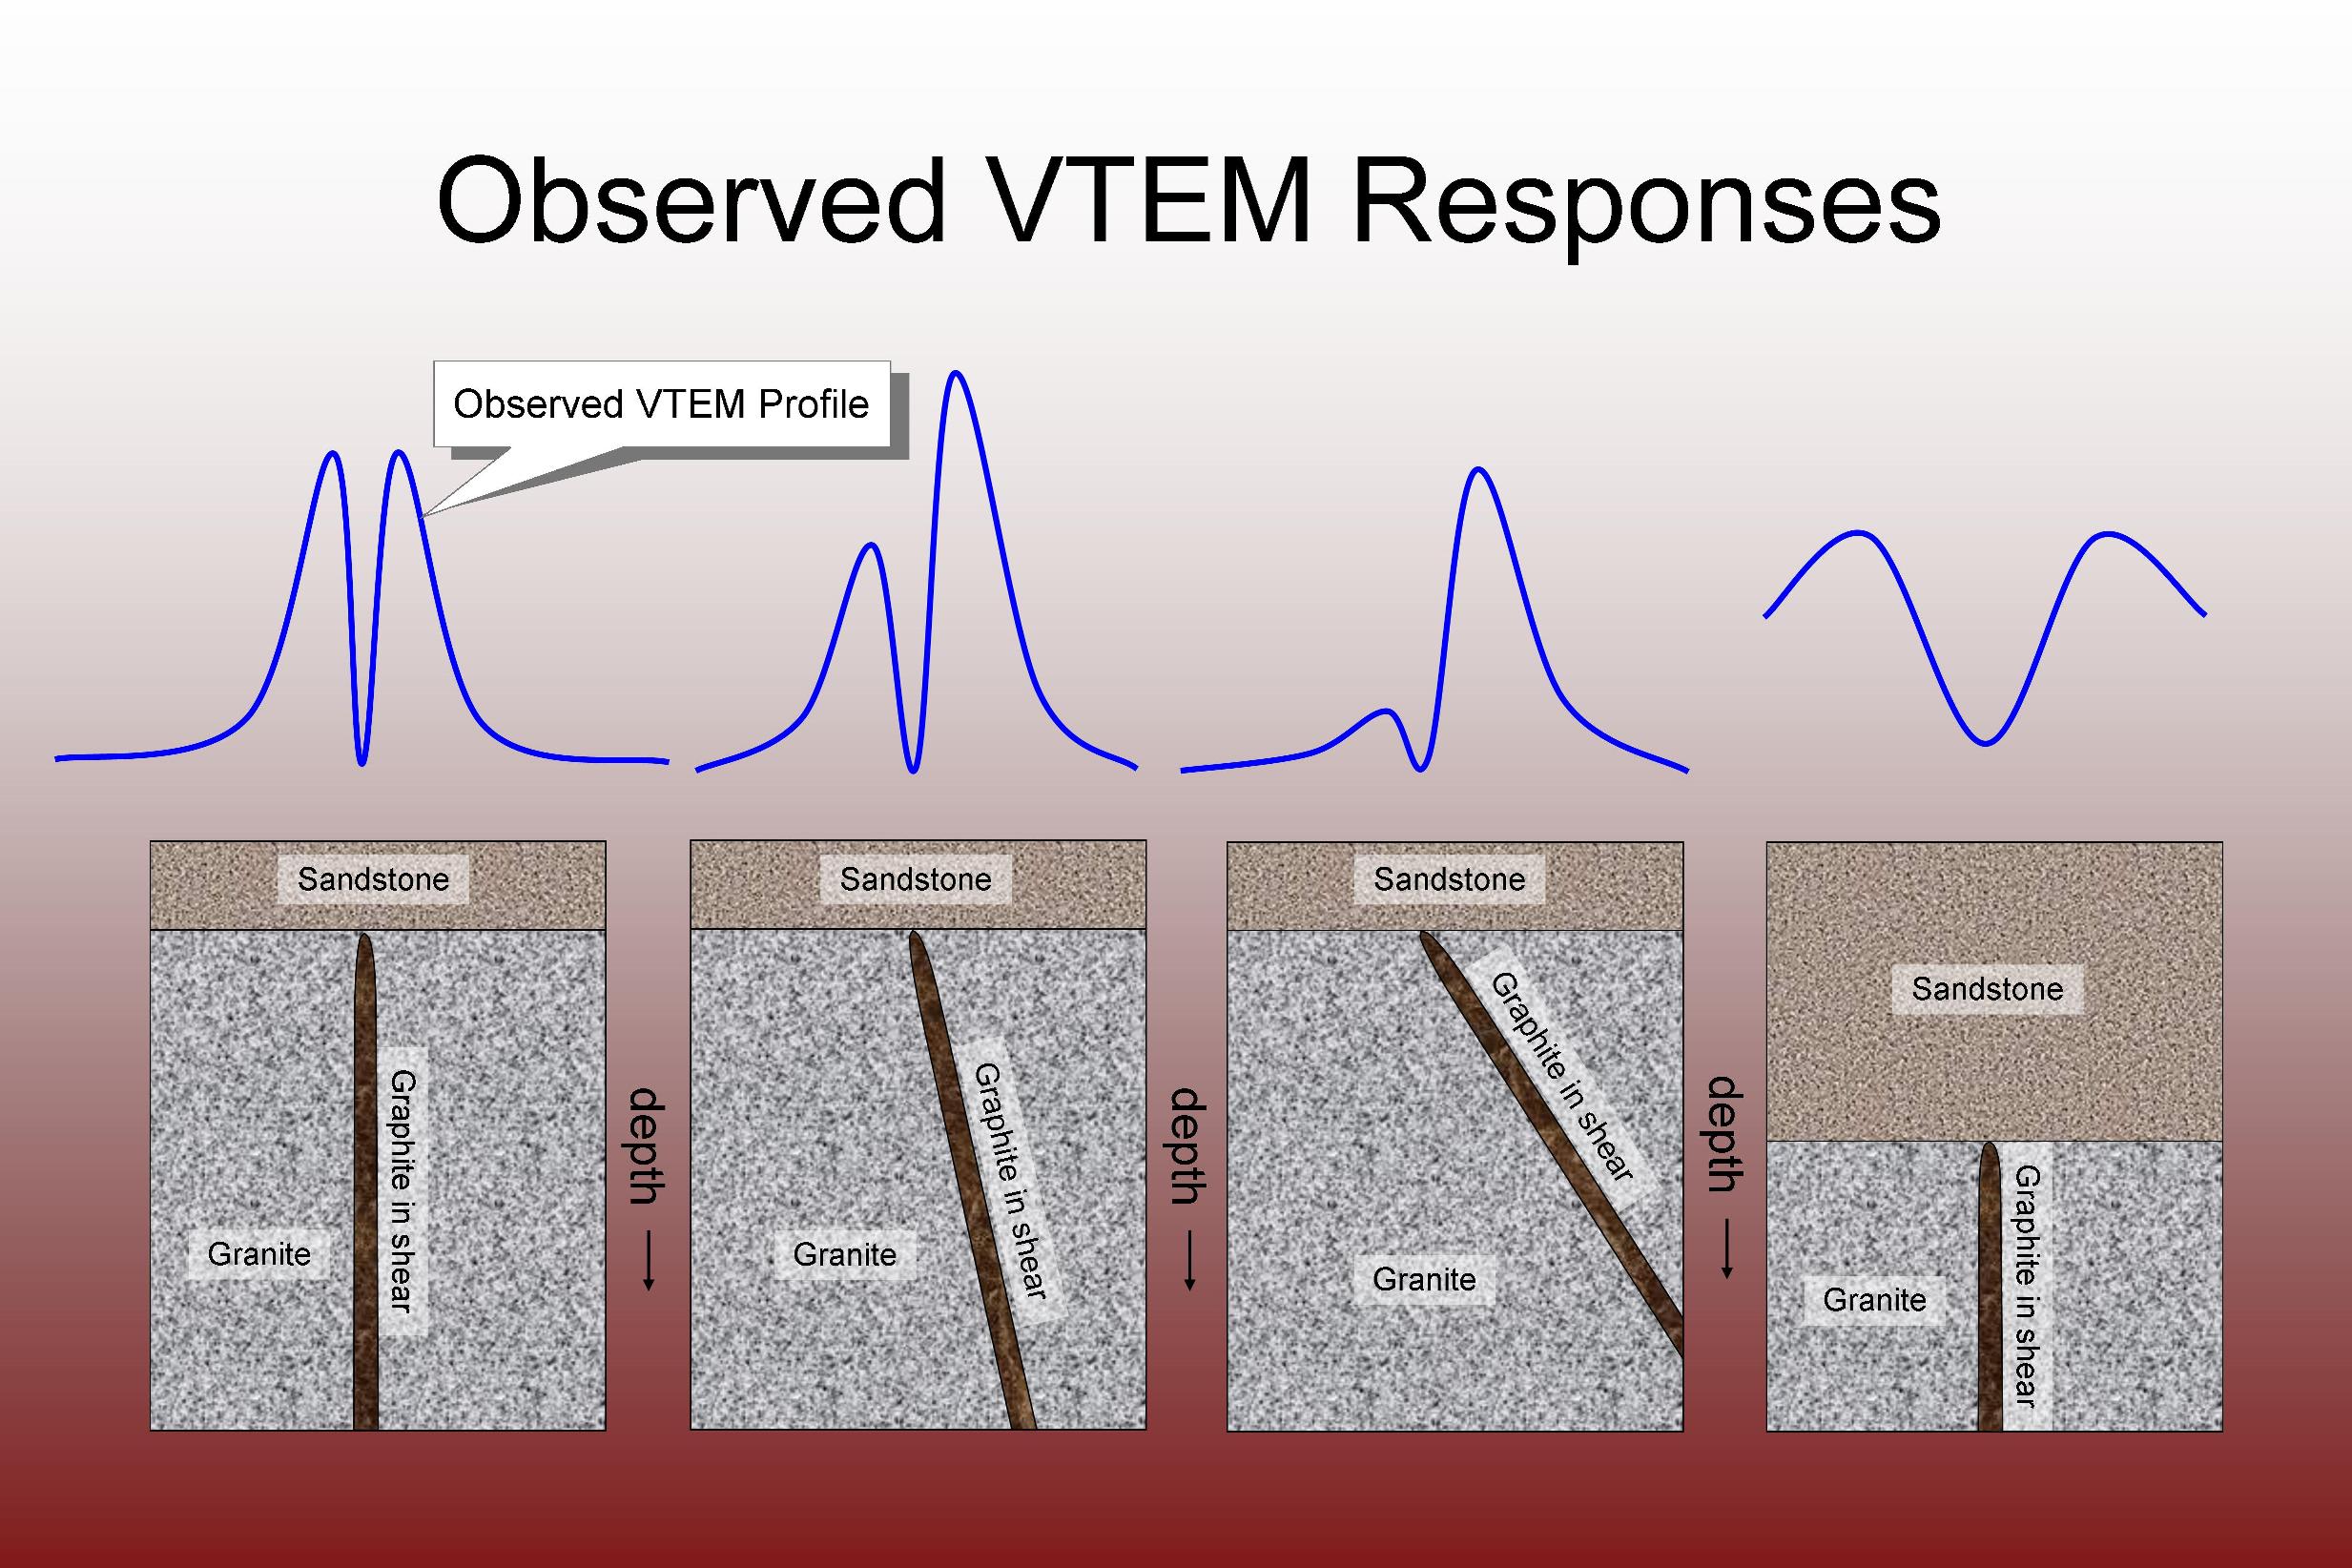
VTEM
In 2002, Geotech a Canadian firm developed, patented and trademarked VTEM, the versatile time-domain electromagnetic system. Time-domain simply means the recording of signal changes with time.
VTEM is useful for detecting and discriminating between moderate to excellent conductors. These types of conductors may include semi-massive to massive sulphide deposits and graphite occurrences. VTEM measurements have a high signal to noise ratio due to the low operating frequency. This enables penetration through conductive surface sediment and rock with depth penetrations of up to 300 metres.
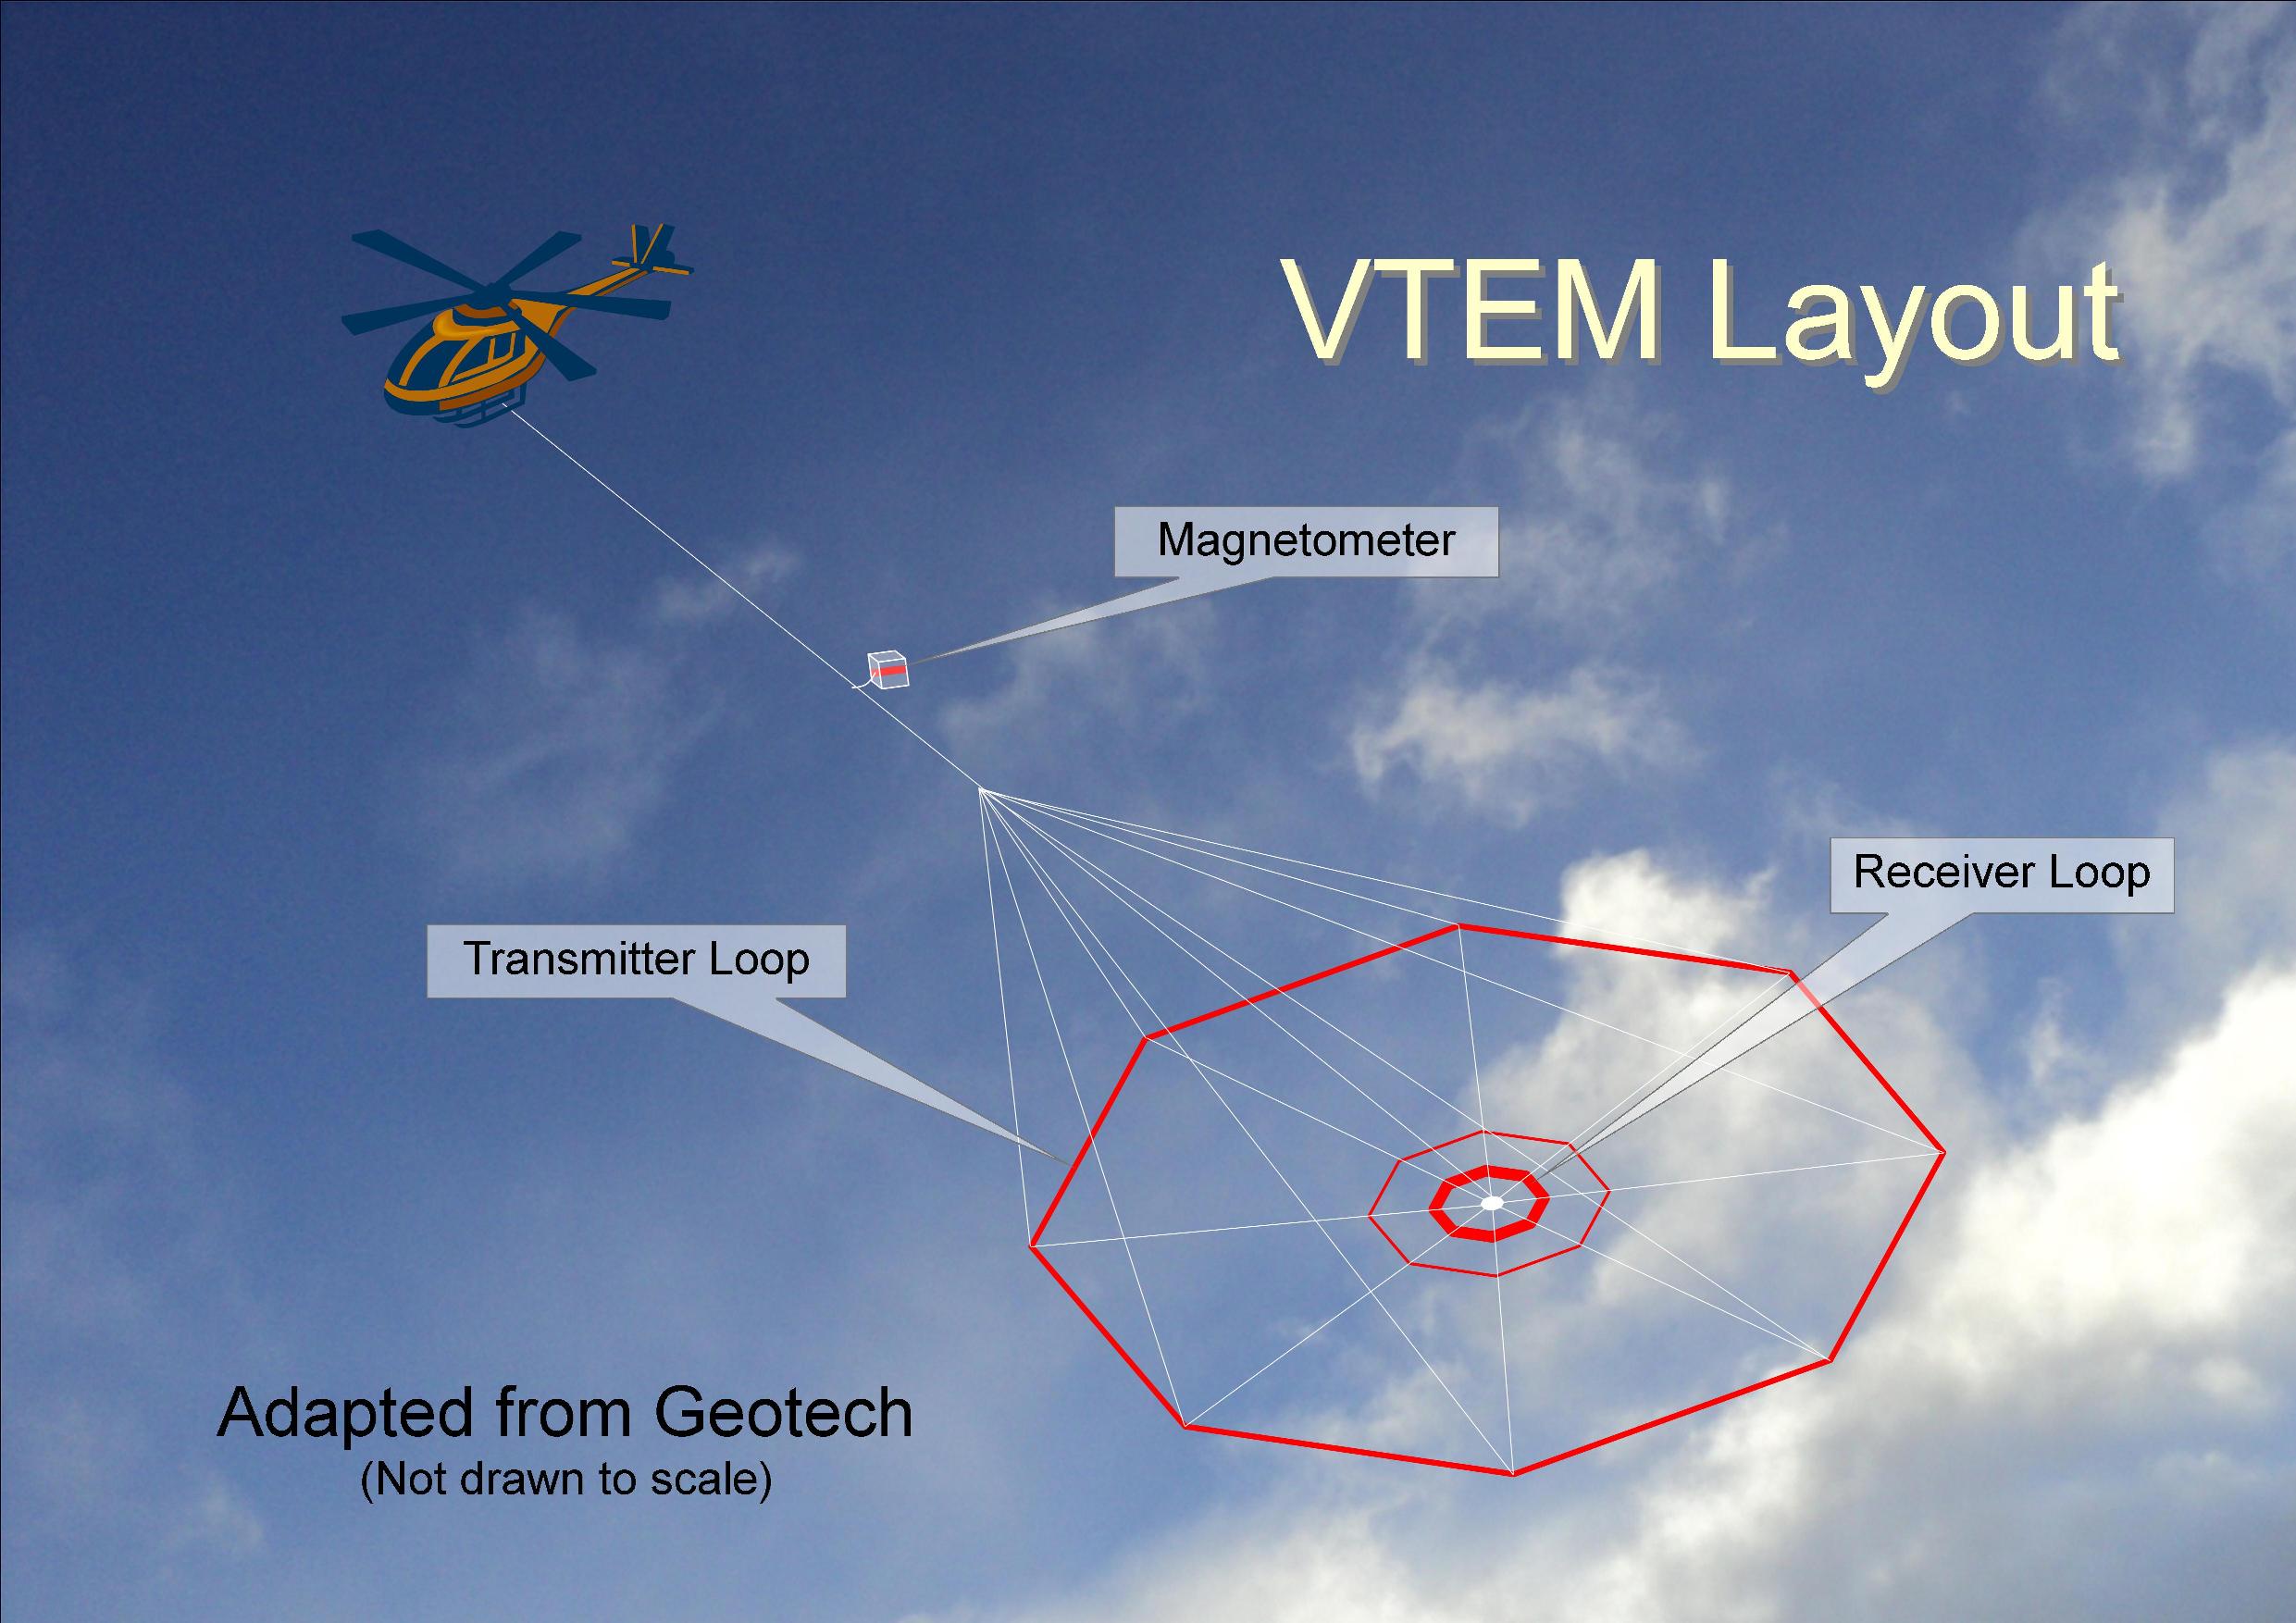
Below is a diagram showing the general layout of VTEM. A receiver loop within a transmitter loop provides a symmetric response allowing the orientation of any conductor to be easily determined. A magnetometer is attached to the line above the transmitter-receiver loop.
Data is recorded every 0.1 second. At a flight speed of 90 kilometres per hour, with the VTEM loops only 30 metres above the ground, equates to a high spatial resolution of 2-3 metres.
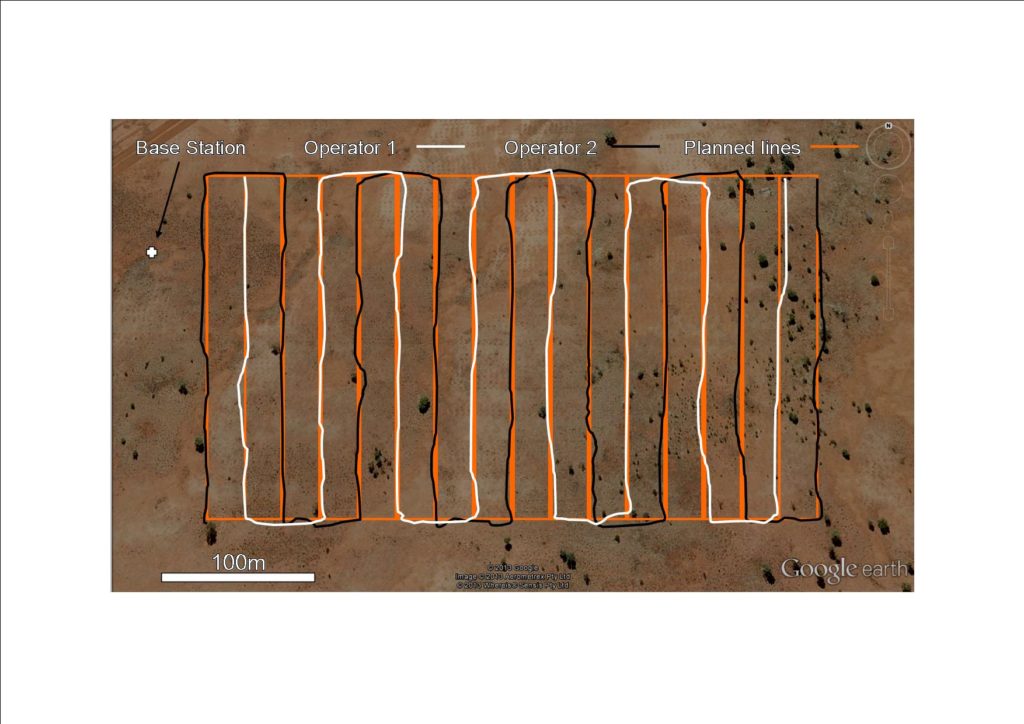
A ground-based station records the daily fluctuations in the earth’s magnetic field, which are affected by solar winds interacting with the Earth’s magnetosphere. These daily or diurnal variations are subtracted from the collected data.
Radiometrics
Radiometrics is considered a passive geophysical exploration technique as it involves measuring the natural radioactivity of soil, sediment and rock that is emitted from the top 30 centimetres of the earth’s surface. The usual flying height for the survey is 80 metres above the ground.
Where does this natural radioactivity come from? To know this we have to understand the makeup of atoms and how some of them have a tendency to break apart.
An isotope is a variety of an element characterised by having a different number of neutrons within its nucleus. Some isotopes are not stable and will undergo radioactive decay. This is a process where the nucleus splits into separate nuclei with the emission of radiation. There are three types of radiation emitted during radioactive decay; alpha radiation, beta radiation and gamma rays. As they travel through air, the different forms of radiation are attenuated at different rates. Alpha radiation, which is composed of helium nuclei, can only travel a few centimetres. Beta radiation, which consists of electrons, can travel up to 1 metre. Gamma rays, a type of electromagnetic radiation, can travel up to several hundred metres through air before being fully attenuated.
Gamma rays are used in radiometric surveys. The energy of gamma rays is dependent on the element from which they come from. An instrument called a gamma ray spectrometer, which is fitted to an aeroplane or helicopter, counts the number of gamma rays received every second and assigns them to their respective energies. This produces a spectrum from which the abundance of uranium (U), thorium (Th) and potassium (K) can be determined. The total count (TC) is the number of gamma rays counted across the entire spectrum and includes those counts attributed to uranium, thorium and potassium.
The number of counts varies depending on factors such as the height of the spectrometer above the land surface, the amount of background radiation present and the type of spectrometer used. The results are corrected and converted to provide meaningful results. Normally, the potassium result is given as a percentage, while thorium and uranium are expressed in parts-per-million (ppm).
Radiometric data is usually displayed as maps. Normally a survey produces four separate maps; a uranium, thorium, potassium and a total count map. Another useful display used is where the uranium is assigned to the colour blue, thorium to green and potassium to red. The three different elements are then combined into the one map called a red-green-blue or RGB image. The combination of these three colours in various ways provides a multi-coloured display. For example, red and blue produces the colour magenta. When this colour is shown on the map, areas high in potassium and uranium are indicated. When the RGB image shows white areas then this is due to high levels of all three elements. Radiometric images usually correlate well with geology maps because different rock types have different abundances of radioactive elements.
The radiometric technique can help to locate areas of potassic alteration, which is commonly associated with hydrothermal deposits. And of course, when exploring for uranium and thorium deposits, it is particularly useful. It can also be used for locating rare earth element (REE) deposits. This is because such deposits may include the mineral monazite which can contain radioactive thorium.
Aeromagnetics
The principle behind an aeromagnetic survey is similar to a ground magnetic survey. However, instead of carrying a magnetometer in a backpack and walking across the landscape, a magnetometer is either carried on board an aeroplane or towed behind at a height of around 100 metres. Aeromagnetics can be done either as a separate survey or in conjunction with other techniques such as VTEM, radiometrics and/or gravity.
The main advantage of an airborne survey over a ground-based one is that a much greater land area can be covered in the same time period. The flight path of an aeromagnetic survey has a similar grid-like fashion to a ground magnetic survey, albeit with a generally greater line spacing. This explains why aeromagnetic surveys tend to be of a lower spatial resolution than ground magnetic surveys.
During the survey, the magnetometer continuously records the total magnetic field intensity immediately beneath the magnetometer. This field consists of daily fluctuations caused by changes in solar wind activity, the regional magnetic field and local variations caused by the underlying rock mineralogy.
Differences in the magnetic susceptibility of rocks are usually attributed to the common mineral magnetite. Specifically, this is used when exploring for magnetite-rich deposits during iron ore exploration. However, occasionally the variations can be caused by the iron sulphide mineral pyrrhotite, which may directly point to a sulphide-rich body containing valuable metals such as copper, lead, zinc, silver and even gold.
Different rock types have different abundances of magnetic minerals. Therefore, with an aeromagnetic survey it is possible to produce maps which show the distribution of different rock types at or close to the earth’s surface. Even geological structures such as faults and folds can be imaged using aeromagnetics.
Anomalies and local variations in rock mineralogy are important to geologists. To see these often subtle features, diurnal variations and the regional field are subtracted from the data. After removal of any obvious artefacts caused by large man-made metal objects, any unusually high or low region in the data that cannot be explained by the known geology is called an anomaly. Geophysics can create models that explain most anomalies. This involves calculating the response that would occur from a particular shape of rock mass containing a certain amount of magnetic minerals at a certain depth.
Just like with ground magnetic surveys, geophysicists process the data in number of ways to enhance the data. Commonly used filters include:
- UC250 – upward continuing standardises data to a specific height above the ground, e.g. to 250 metres. It helps to remove or minimise shorter wavelengths in the data associated with surface magnetism and enhances longer wavelengths from deep objects and structures.
- RTP – reduced-to-pole removes any polarity in the data; and
- 1VD and 2VD – the first and second vertical derivatives are obtained to reveal subtle changes in the gradient of the magnetic data.
DEM/DTM
Another output of most airborne surveys is a digital elevation model (DEM) or digital terrain model (DTM) of the flown landscape. The height above sea level of the aircraft at a particular location is known from the GPS data collected and the height above the land surface is known from the radar altimeter recordings of the aircraft. It is a simple matter of subtracting the two to get the height of the landscape above sea level.
Geologists use DEMs to accurately locate the elevation of drill-hole collars. This is particularly important when constructing geological cross-sections from data obtained from drill-hole logs. This ensures that the cross-sections are vertically accurate.
Another use for DEMs is that other geospatial layers can be draped over a 3-dimensional digital elevation model. This can provide valuable insights into how topography is affected by certain rock types, which may help with identifying other prospective areas with similar topography.
Companies Referenced
- Geotech (www.geotech.ca)
Further Reading
Subscribe for Email Updates

Pingback: Review of “Fission Discovers Strong Uranium Anomalies Up to 3km Long at North Shore, AB” | Geology for Investors