Introduction
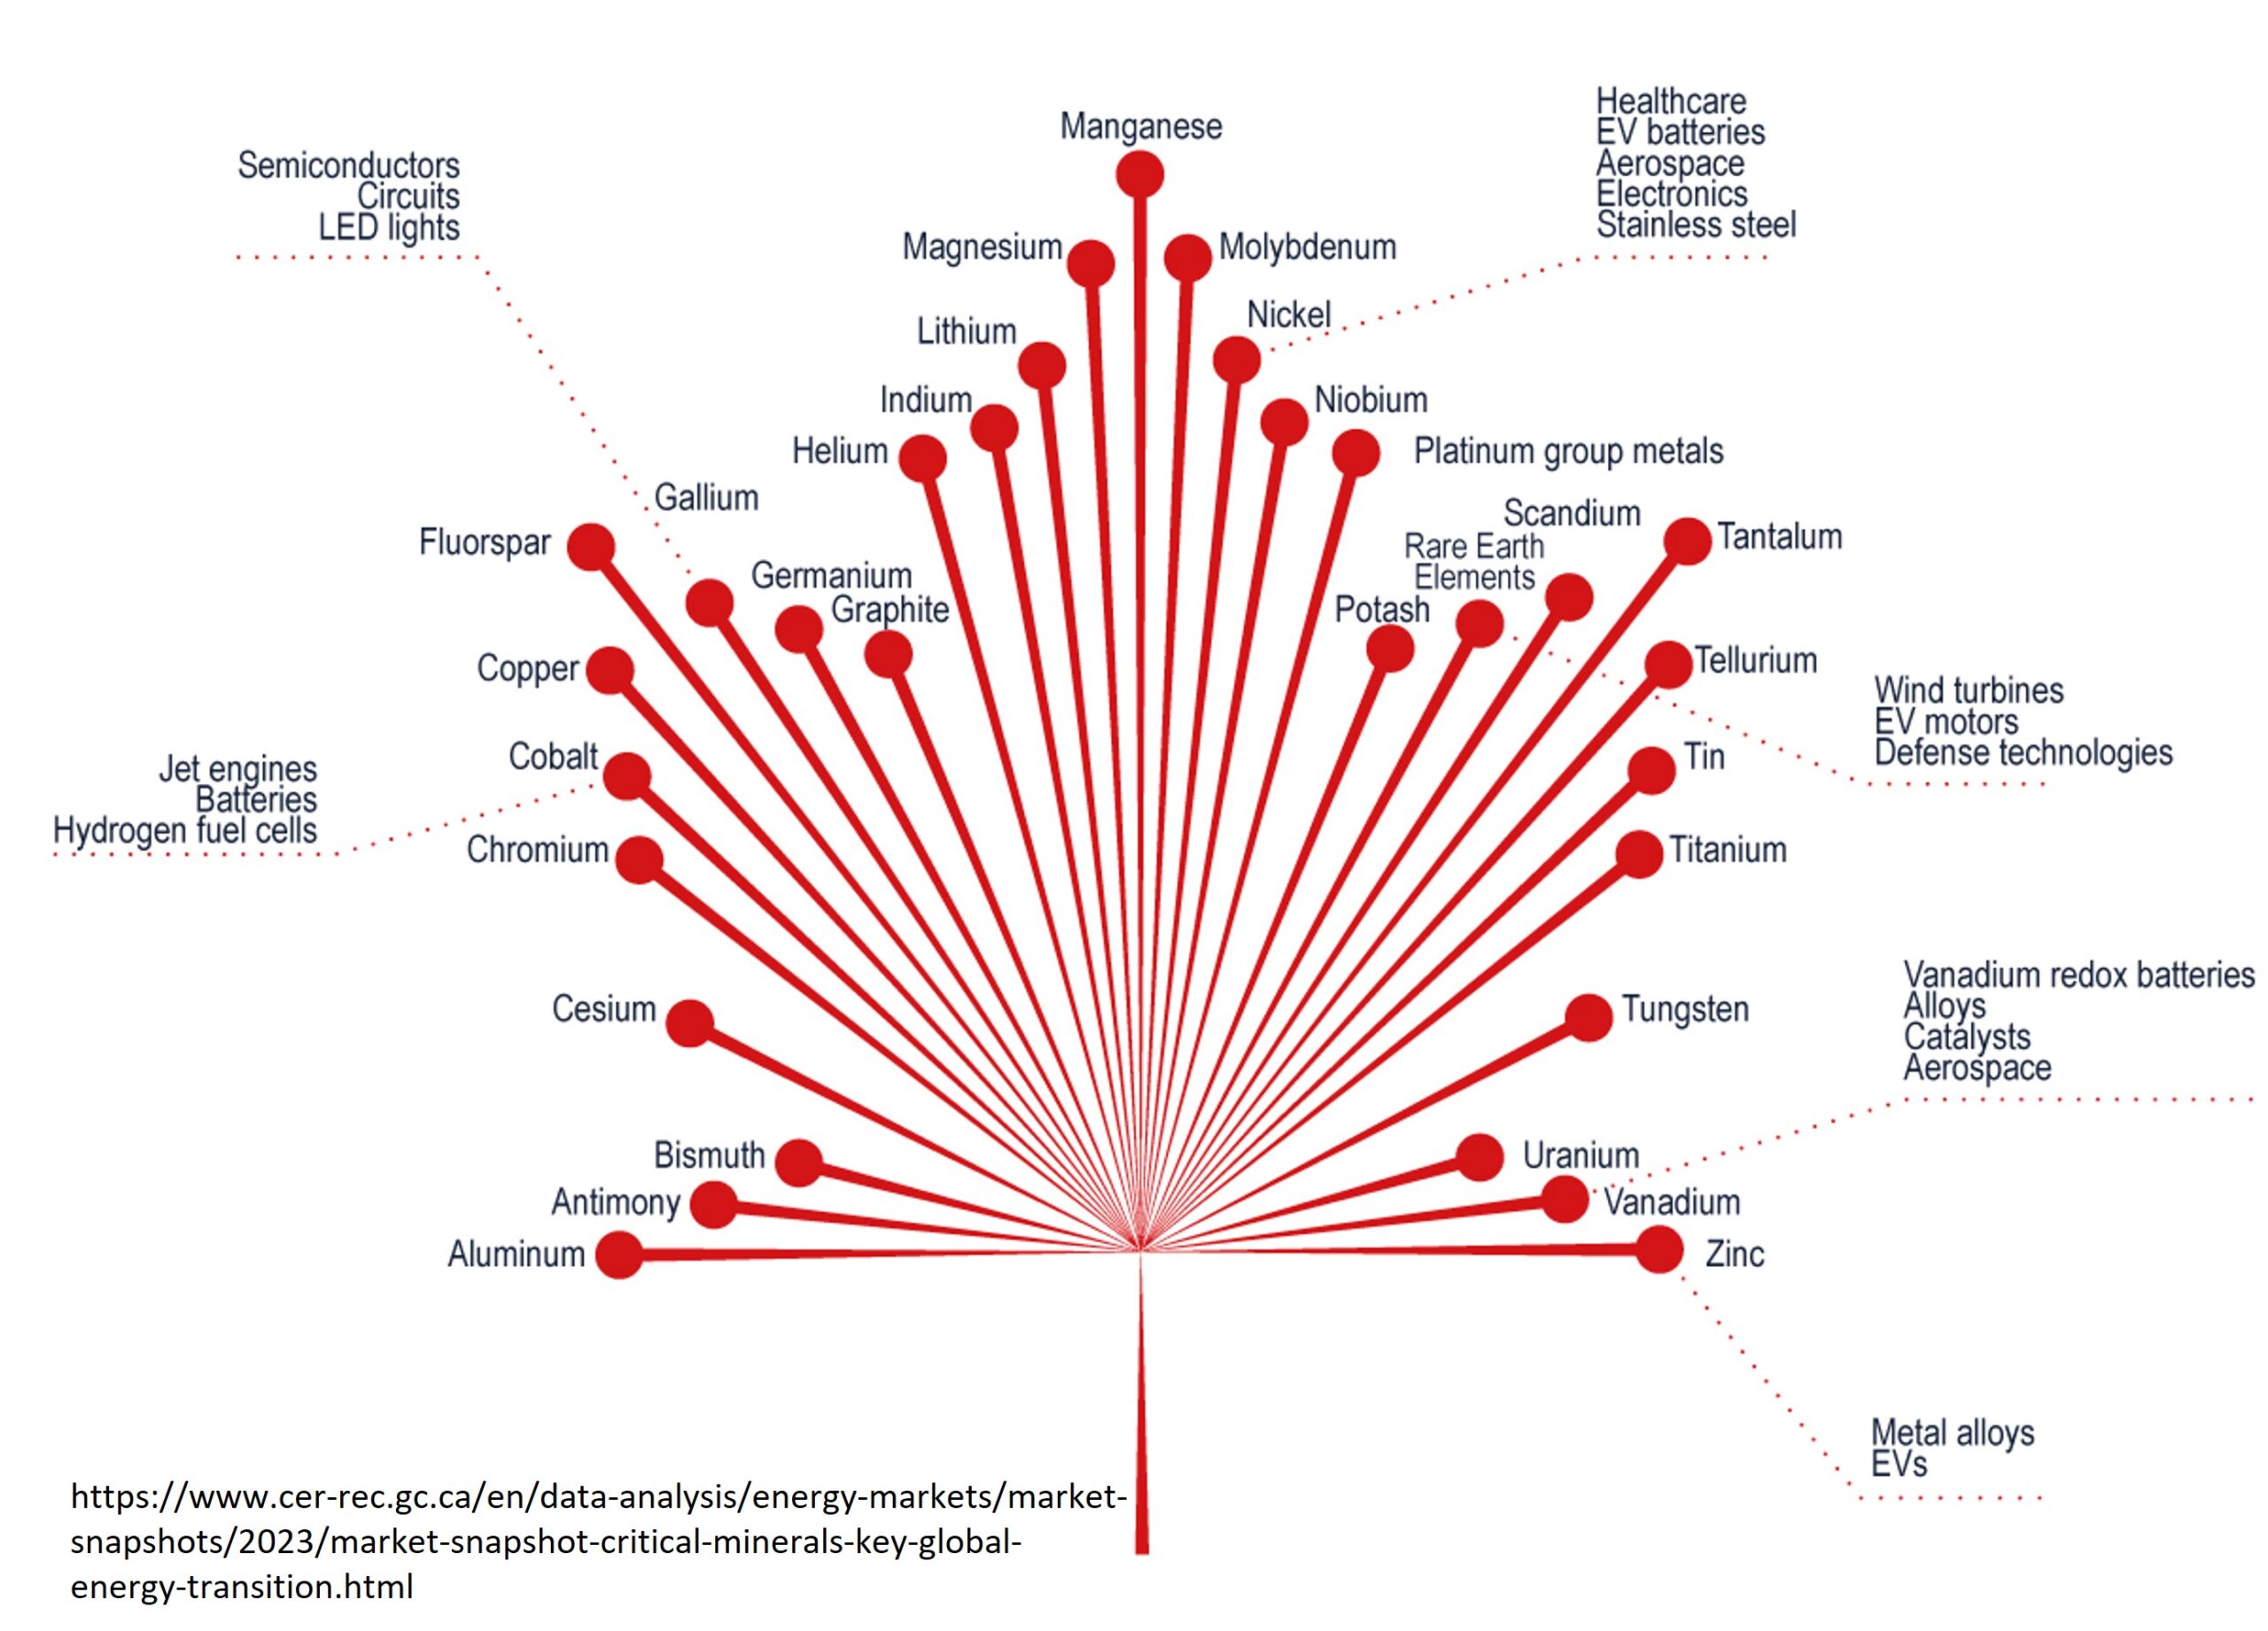
In early 2020 a collaborative initiative between the US, Canada and Australia was established to secure supply of minerals deemed essential for the economies and security of these three nations, the US in particular. These so-called ‘critical minerals’ comprise 35 elements including platinum group metals, rare earth elements, and others including cobalt, gallium, graphite, aluminium and titanium. These elements are vulnerable to scarcity due to geological, political, or technical factors.
The designation of critical minerals is not permanent and is expected to change with time and geopolitical factors. These elements are used in a myriad of applications from batteries, electronics and protective coatings to name a few. They permeate daily life, with the average smartphone containing at least 8 critical minerals. As economies gear towards increased renewable energy and electrical vehicle production, these elements are predicted to become more important.
The US is well known for its dependence on importing metallic elements and alloys for its own industries. In 2019 the country was 100 % reliant on foreign sources for 13 elements categorized as critical minerals. Currently, the supply to the global critical mineral market is dominated by China (Fig. 1). However, in recent years China has demonstrated its capacity to leverage its dominance in the critical mineral market to promote its political objectives, threatening to throttle supply to countries who have no viable alternatives for supply.
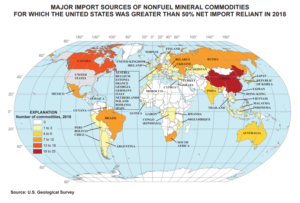
This has led the US to seek to develop new supply chains with Australia and Canada, its long-lived trading partners, and primary western suppliers of non-fuel mineral commodities (Fig. 1). In addition to forming bilateral trade relations with these countries, the US has engaged in the Critical Mapping Initiative with the US Geological Survey, the Geological Survey of Canada and Geoscience Australia to develop a diversified resource base of critical minerals.
This initiative will involve a tiered approach to reach its goals:
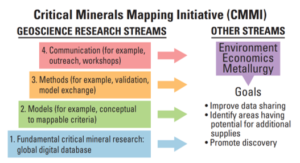
Underpinning these goals will involve a coordinated mineral systems approach, for mapping and modeling the distribution of critical minerals across the globe. By collating the various geologic processes that control the formation, enrichment, and preservation of ore deposits, the sites of new deposits can be predicted.
Factors Leading Up To This Point
So, why the sudden push for this international collaboration for mineral supplies? To understand, we must go back to 2010, and assess two events associated with the rare earth element (REE) market in China:
- China classifies REE as strategic minerals:
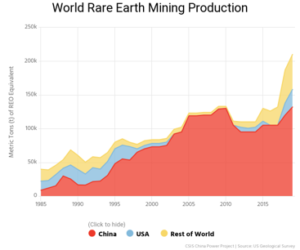
In 2010 China dominated global REE production, supplying over 90 % of the world’s REE supply, including its own (Fig. 3). Foreseeing the exponential growth trajectory of its manufacturing industry China designated REE as strategic commodities, which it prioritised for use in its domestic market. At the same time, it was battling domestic issues of rampant illegal mining, and poor environmental standards. Attempting to ameliorate these issues while meeting domestic demands, the government increasingly constricted its REE export policies and quotas, forcing local companies to comply with new regulatory standards.
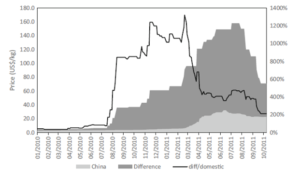
This strangulation of the REE market resulted in a skyrocketing 1000 % increase in foreign REE prices in 2011, by which time China controlled 97 % of the global market (Fig. 4).
- China clashes with Japan over sovereignty:
The islands of Senkaku/Diaoyudao in the East China Sea are contested territory between Japan and China. In 2010, a Chinese fishing boat rammed a vessel of the Japanese coast guard. The event culminated in the arrest of the fisherman by Japanese authorities. In response to this arrest, China abruptly banned REE exports to Japan for two months. At the time Japan was reliant on China for 80 % of its REE supply, and had no alternative recourse.
In 2016 REE prices relaxed to early 2010 levels as China relaxed its export taxes and quotas in 2015. However, the collective effects of these two factors shocked many governments out of complacency with respect to their mineral resource supplies, initiating an international push to wean off the Chinese supply chain.
Today, China remains the main driver of global REE demand. Due to rapid growth in the renewable energy and electric vehicle sectors China’s production of renewable and nuclear energy more than tripled from 2007 to 2017, accounting for 51 % of global increase in production during that period. As this demand is growing China will become increasingly dependent on REE imports, of which it is already the largest net importer in the world.
Globally, consumption of REE is increasing at 8 – 12 % per year, and industrial demand is projected to increase by 2600 % by mid-decade. As such it is expected that China will be unable to meet growing domestic and foreign REE demand by mid-decade. This will significantly reduce Beijing’s hold on the global market and foster rapid development of international resources.
To date there are only two significant rare earth mines owned by Western companies and operated outside of China:
- Mount Weld mine in Australia owned by Lynas Corp (ASX: LYC; US-OTC: LYSDY), which sends its concentrate to Malaysia for processing.
- Mountain Pass mine owned by MP Minerals in California (which ships its concentrate to China).
Despite the clear urgency of many nations to diversify their supply chains, progress has been slow, and China remains the dominant global force in REE supply, producing 80 % of global output in 2019. As tension between the US and China has become increasingly strained, the Trump administration announced a federal strategy in 2020 aimed at accelerating this process through the Critical Mineral Mapping Initiative.
What New Investment Opportunities Will Arise?
As countries around the globe scale up industry supply for the green energy market, as well as nuclear and tech, investors can expect stable and increasing prices in the critical minerals market for several decades to come. Through the CMMI and other similar initiatives, a multitude of mining projects and associated processing companies are going to come online. Fig. 5 shows a map of known critical mineral resources with active projects in Australia, Canada and the US. An interactive map of these projects, as well as other critical mineral resources across the globe, hosted by the USGS can be accessed here.
Critical Mineral Projects Expected To Come Online Within 5 Years:
Canada:
- REE: Quest Rare Minerals (TSE:QRM) Strange Lake Project
- REE: Matamec’s Zeus-Kipawa (TSX.V:MAT) joint venture in Quebec
- REE Avalon Rare Metals (TSE:AVL) Nechalacho Project in the Northwest Territories
Australia:
- Tungsten: Thor Mining (ASX:THR) Molyhil
- Tungsten: EQ Resources (ASX:EQR)
- Lithium: Altura Mining (ASX:AJM) Pilgangoora project
- Lithium: Galaxy Resources (ASX:GXY) Mount Cattlin asset
- REE: Arafura Resources (ASX:ARU) Nolans Project
- REE: Northern Minerals (ASX:NTU) Browns Range Project
- Titanium: Iluka Resources (ASX:ILU)
- Titanium: US company Tronox Holdings (NYSE:TROX)
- Graphite: Hexagon Energy Materials (ASX:HXG) McIntosh project
Additional Reading
- USGS Mineral Commodity Factsheets: website
- On China’s REE monopoly: website
- Market opportunities for Australian critical minerals: website
Sources
- China Power (2020) Does China Pose a Threat to Global Rare Earth Supply Chains? (website)
- Kelley KD (2020) International geoscience collaboration to support critical mineral discovery: U.S. Geological Survey Fact Sheet 2020–3035. US Geological Survey (pdf)
- Shen Y, Moomy R, Eggert RG (2020) China’s public policies toward rare earths, 1975–2018. Miner Econ 33:127–151. (academic article)
- US Geological Survey (2020) Mineral Commodity Summaries 2020: US Geological Survey. US Geological Survey (website)