[box type=”info” align=”aligncenter” ]Disclaimer: This is an editorial review of a public press release and not an endorsement. It may include opinions or points of view that may not be shared by the companies mentioned in the release. The editorial comments are highlighted so as to be easily separated from the release text and portions of the release not affecting this review may be deleted. [/box]
KIRKLAND LAKE, ONTARIO–(Marketwired – Feb. 25, 2014) – Kirkland Lake Gold Inc. (the Company) (TSX:KGI) (AIM:KGI), an operating and exploration gold company, is pleased to announce recent drilling results from its ongoing surface diamond drilling exploration program. This latest program utilized one drill rig on the Macassa Property, west of the South Claims property boundary, in a continuing effort to define potential near surface resources.
[box type=”note” align=”aligncenter” ]
Kirkland Lake Gold is a good example of a mid-size, mid-grade producer. Like every other gold producer they’ve been hit by the decline in the the price of gold over the past year. In response to these “new economics” the company has endeavoured to cut costs while simultaneously trying to increase production and grades. While part of the company’s cost cutting has been to reduce the exploration program expenditures they have thankfully kept one exploration drill working on their most prospective targets.
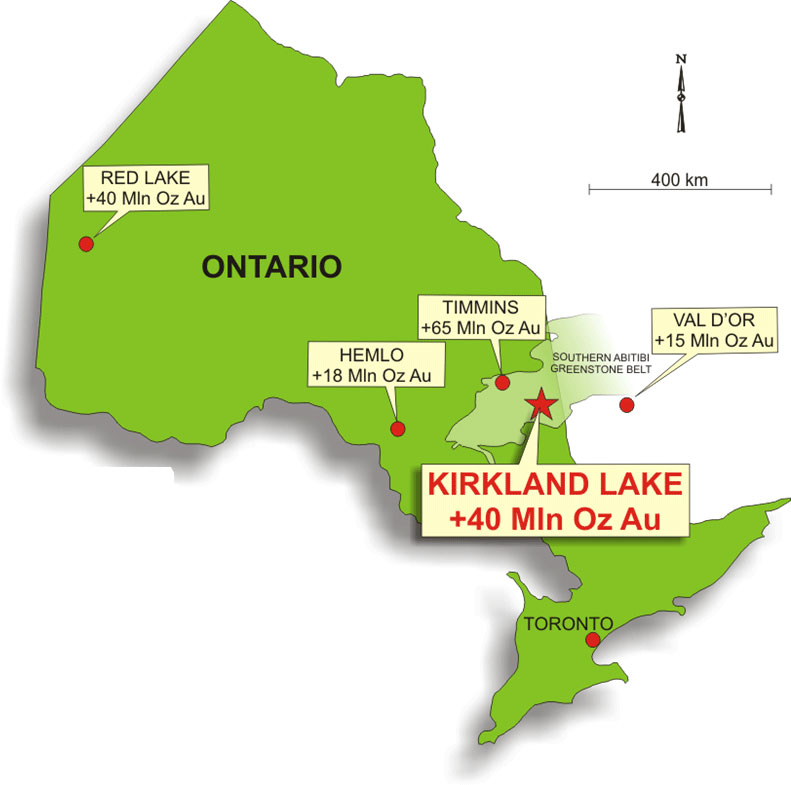
Kirkland’s properties are located in the Southern Abitibi Greenstone Belt in Northern Ontario. We’ve included a location map below.
[/box]
Mr. George Ogilvie, CEO commented, “We are very pleased with the results to date of this surface exploration program and are excited to shortly be able to announce a reserve and resource calculation on ounces close to surface for the first time in the Company’s history. Intersections from the surface campaign to date have shown mineralization from surface to 1000-foot depth, which have the potential to be mined from a ramp or decline. The surface program will continue throughout the year as exploration continues both east and west from this area.”
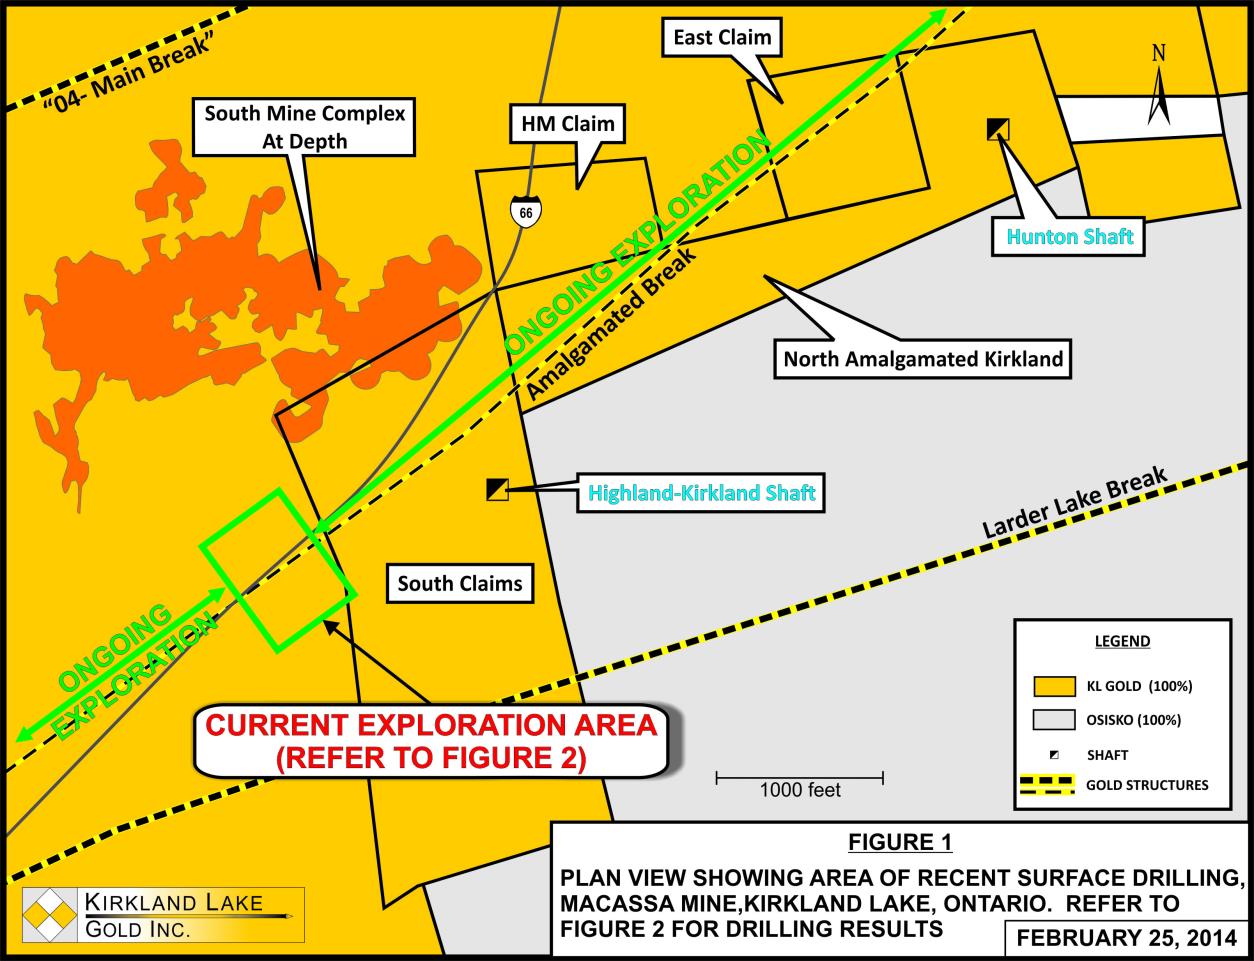
This phase of the surface exploration program was designed to follow up on the earlier success of drilling programs testing for near surface mineralization associated with the Amalgamated Break (see the Company’s news releases dated February 28, 2012, September 5, 2012 and June 18, 2013). The Amalgamated Break had seen limited historic exploration prior to the recent drilling campaign initiated by the Company.
[box type=”note” align=”aligncenter” ]
The “Amalgamated Break” is part of a large scale structural fault system that extends from Val d’Or, Quebec east to Timmins, Ontario and hosts several world class gold mining camps. The gold was deposited by structurally controlled hydrothermal activity in the Archean aged (2.5+ billion years old) greenstone belt. Similar large scale fault systems host many of the gold deposits in the Canadian Shield.
We’ve included a map below which shows the Amalgamated Break and current area of exploration drilling.
[/box]
This phase of drilling has been successful on a number of fronts:
- Numerous drill holes intersected a third, previously undiscovered, zone of continuous high grade gold mineralization (Zone 3) west of the current known mineralized area. This mineralized zone lies footwall to the previously discovered Zone 1 and Zone 2 (See the Company’s new release dated June 18, 2013).
- Recent drilling intersected high grade gold mineralization 950 feet below surface, which is 550 feet deeper than the previously defined 400 foot elevation.
- Recent drilling has produced the highest grade intersection to date in the current surface drilling campaign (50.11 ounces of gold per ton (opt) over 1.4 feet true width). This phase of drilling also produced several sporadic high grade gold intercepts
- The broad zone of alteration and mineralization associated with the Amalgamated Break has now been defined at over 3,500 feet along strike and is open to drilling outside this current limit.
The following are some of the highlights of the drilling program:
- Drill hole AB-13-108 intersected Zone 3 and returned 50.11 opt uncut over 1.9 foot of core length (1.4 feet true width). This intersection is 920 feet below surface and contained significant visible gold. This represents the highest grade intercept to date in the current surface exploration campaign, as well as one of the deepest intercepts of this program to date.
- Drill hole AB-13-106 intersected Zone 3 and returned 6.95 opt uncut over 1.0 foot of core length (1.0 feet true width). This intersection is approximately 500 feet below surface and contained visible gold.
- Drill hole AB-13-151 intersected Zone 3 and returned 1.18 opt uncut over 7.5 foot of core length (7.2 feet true width). This intersection is approximately 470 feet below surface and contained significant visible gold.
- Drill hole AB-13-151 also intersected a new zone hanging wall to Zone 3 that returned 0.98 opt uncut over 3.3 feet of core length (true width unknown). This intersection is approximately 200 feet below surface and may be related to Zone 1 or Zone 2 which are currently defined to approximately 1000′ feet east of this intersection.
This drill program is being carried out utilizing one drill rig on surface and will continue to focus on defining gold mineralization both east and west of the current known limits of all three zones.
[box type=”note” align=”aligncenter” ]
You’ve probably noticed by now that Kirkland is reporting its results in feet and ounces per ton. I’m not sure if this is part of a strategy designed to appeal to a wider investment base or whether they have some stubborn old school managers, but you certainly don’t see imperial units reported very often these days. For reference:
- A “short” ton is 2,000 lbs
- A metric tonne is 1000 kg (where a 1 kg is approximately 2.2 lbs)
- A troy ounce is 31.1034768 grams (not to be confused with a typical US imperial ounce which is 28.3495 grams
- 1 troy ounce per short ton (opt) = 34.2857 grams per metric tonne (gpt or g/t)
- 1 gram per tonne = 0.0292 troy ounces per short ton
As part of its efforts to become more efficient, the company recently increased its minimum cut-off grade to 0.22 opt from 0.18 opt. In metric terms, this is the equivalent of raising its minimum grade from 6.17 g/t to 7.54 g/t.
[/box]
The following tables summarize the latest drilling results in imperial values:
SOUTH CLAIMS SURFACE EXPLORATION
| DRILL HOLE No. | ZONE | FROM (feet |
) | TO (feet |
) | HOLE DIP (degrees |
) | AZIMUTH (degrees |
) | ASSAY (oz per ton/feet |
) | |
| AB-13-108 | Zone 3 | 1,009.7 | 1,011.6 | -68 | 326 | 50.11/1.9′ CL=1.4′ TW, VG | ||||||
| 3.50/1.9′ CL=1.4′ TW, *CUT | ||||||||||||
| AB-13-106 | Zone 3 | 813.4 | 814.4 | -34 | 313 | 6.95/1.0′ CL=1.0′ TW, VG | ||||||
| 3.50/1.0′ CL=1.0′ TW, *CUT | ||||||||||||
| AB-13-151 | New | 262.5 | 265.8 | -47 | 334 | 0.98/3.3′ CL=??’ TW, VG | ||||||
| Zone 3 | 621.2 | 628.7 | 1.18/7.5′ CL=7.2′ TW, VG | |||||||||
| AB-13-90 | Zone 3 | 741.8 | 743.5 | -58 | 306 | 0.02/1.7′ CL=??’ TW | ||||||
| AB-13-92 | Zone 3 | 650.1 | 651.1 | -42 | 305 | 0.17/1.0′ CL=??’ TW | ||||||
| AB-13-97 | Zone 3 | 962.8 | 963.9 | -64 | 323 | 0.21/1.1′ CL=??’ TW | ||||||
| AB-13-98 | Zone 3 | 915.3 | 916.3 | -57 | 324 | 0.22/1.0′ CL=??’ TW | ||||||
| AB-13-103 | Zone 3 | 1,020.9 | 1,021.9 | -71 | 315 | 0.44/1.0′ CL=??’ TW | ||||||
| AB-13-107 | Zone 3 | 930.8 | 931.8 | -56 | 310 | 0.15/1.0′ CL=??’ TW | ||||||
| AB-13-109 | Zone 3 | 863.5 | 864.5 | -53 | 326 | 0.11/1.0′ CL=??’ TW | ||||||
| AB-13-110 | Zone 3 | -43 | 327 | NSV | ||||||||
| New | 848.5 | 849.5 | 0.87/1.0′ CL=??’ TW | |||||||||
| AB-13-123 | -80 | 327 | NSV | |||||||||
| AB-13-124 | New | 938.1 | 939.1 | -65 | 331 | 1.63/1.0′ CL=??’ TW, VG | ||||||
| Zone 3 | 975.5 | 976.5 | 0.56/1.0′ CL=0.9’TW | |||||||||
| AB-13-125 | Zone 3 | -69 | 308 | NSV | ||||||||
| AB-13-137 | Zone 3 | 934.1 | 935.8 | -62 | 327 | 0.46/1.7′ CL=1.5′ TW, VG | ||||||
| AB-13-138 | New | 1,033.0 | 1,035.0 | -70 | 304 | 0.25/2.0′ CL=??’ TW | ||||||
| Zone 3 | NSV | |||||||||||
| AB-13-139 | Zone 3 | 1,045.9 | 1,047.1 | -71 | 335 | 0.15/1.2′ CL=1.8′ TW | ||||||
| AB-13-144A | Zone 3 | -70 | 309 | NSV | ||||||||
| AB-13-145 | Zone 3 | 1,019.2 | 1,021.5 | -69 | 333 | 0.27/2.3′ CL=1.9′ TW | ||||||
| AB-13-152A | Zone 3 | -58 | 347 | NSV | ||||||||
| AB-13-153 | Zone 3 | -45 | 343 | NSV | ||||||||
| AB-13-154A | Zone 3 | 650.3 | 651.3 | -47 | 353 | 2.86/1.0′ CL=0.9′ TW, VG | ||||||
| AB-13-155 | Zone 3 | -45 | 356 | NSV | ||||||||
| AB-13-156 | Zone 3 | 646.0 | 647.3 | -40 | 319 | 0.55/1.3′ CL=1.3′ TW, VG | ||||||
| AB-13-162 | New | 230.5 | 232.1 | -52 | 320 | 1.87/1.6′ CL=??’ TW, VG | ||||||
| Zone 3 | 659.5 | 660.7 | 1.16/1.2′ CL=1.1′ TW, VG | |||||||||
| AB-13-166 | Zone 3 | 637.2 | 640.2 | -44 | 325 | 1.21/3.0′ CL=3.0′ TW, VG | ||||||
| AB-13-167 | Zone 3 | 689.5 | 694.5 | -39 | 306 | 1.04/5.0′ CL=4.9′ TW, VG | ||||||
| AB-13-168 | Zone 3 | 692.5 | 693.5 | -58 | 315 | 1.58/1.0′ CL=0.9′ TW, VG | ||||||
| AB-13-170 | New | 699.9 | 700.9 | -66 | 316 | 1.08/1.0′ CL=??’ TW | ||||||
| Zone 2 | 764.0 | 765.0 | 0.18/1.0′ CL=?? TW | |||||||||
| AB-13-171A | Zone 3 | 701.8 | 702.8 | -51 | 001 | 2.24/1.0′ CL=1.0′ TW, VG | ||||||
| AB-13-172 | New | 270 | 271 | -47 | 323 | 1.25/1.0′ CL=??’ TW, VG | ||||||
| Zone 3 | 670.5 | 672.0 | 3.39/1.5′ CL=1.5′ TW, VG | |||||||||
| AB-13-173 | New | 581.8 | 583.2 | -53 | 327 | 1.02/1.4′ CL=??’ TW, VG | ||||||
| Zone 3 | 713.0 | 716.0 | 0.11/3.0′ CL=??’ TW |
TW = True Width, CL = Core Length, VG = Visible Gold, ?? TW = True Width Unknown, NSV=No Significant Values *Cut = cut to 3.5 opt
[box type=”note” align=”aligncenter” ]
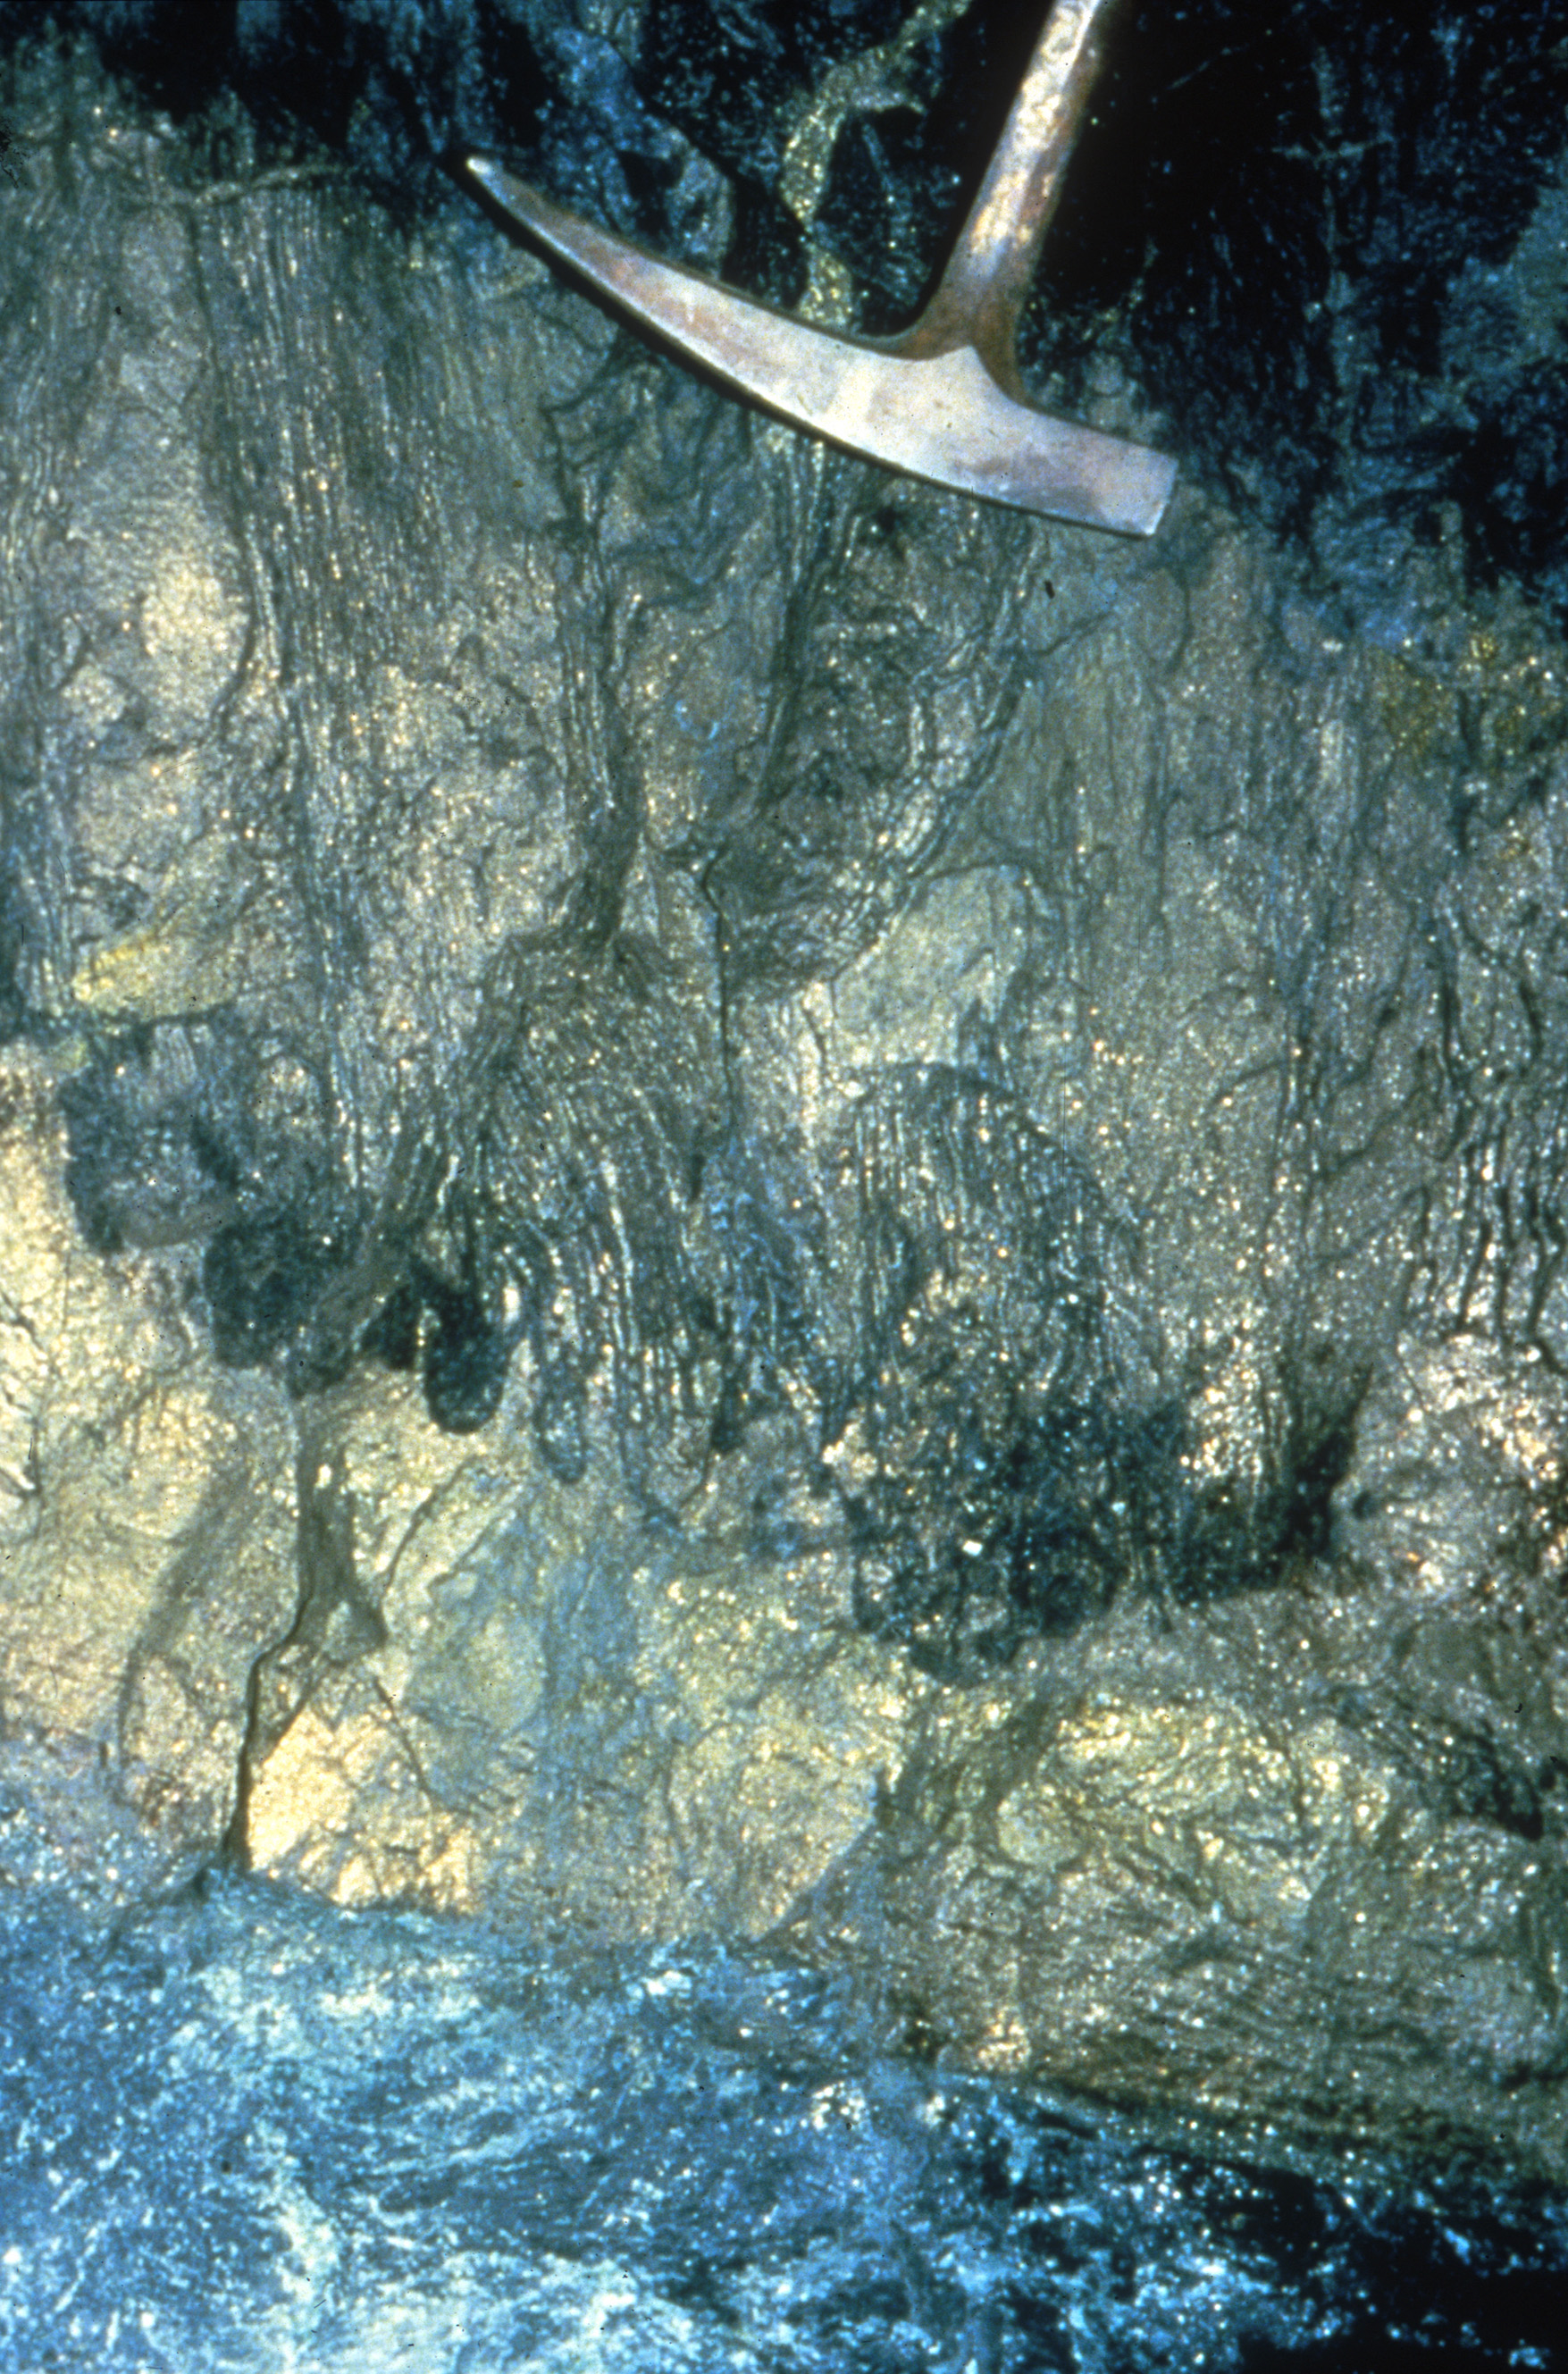
These drill results are a little confusing compared to what we are used to seeing in company releases. However, they do give us some extra bits of information that we don’t usually get: Intervals with visible gold (VG) are being reported as well as true widths where known.
For example: “1.58/1.0′ CL=0.9′ TW, VG” is 1.58 ounces per ton over 1 foot with a true width of 0.9′. The sample also showed visible gold. Notation of visible gold during drill core examination is a good way to cross-check the assay results since a significant gold assay would be expected where gold is visibly present.
Normally assays are “cut” as part of a QA/QC program in order to remove outliers from the geochemical data. Essentially the maximum reportable grade is capped at a certain level. The rationale is that if a value is too high, it may skew the overall grade averages resulting in inaccurate results. Kirkland has capped the results at 3.5 opt or about 120 g/t, but the “cut” marked samples assayed higher than 3.5 opt.
They also give us the angle and direction of the drilling. This doesn’t really help us much, but it is worth noting that diamond drill-holes are rarely if ever drilled straight down. Drill holes are typically planned to cut across a known structure or geophysical anomaly.
The company has also reported these same results converted to metric units below.
[/box]
The following tables summarize the latest drilling results in metric values:
SOUTH CLAIMS SURFACE EXPLORATION
| DRILL HOLE No. | ZONE | FROM (m |
) | TO (m |
) | HOLE DIP (degrees |
) | AZIMUTH (degrees |
) | ASSAY (grams per tonne/metres |
) | |
| AB-13-108 | Zone 3 | 307.8 | 308.3 | -68 | 326 | 1,718.06/0.6m CL=0.4m TW, VG | ||||||
| 120.00/0.6m CL=0.4m TW, *CUT | ||||||||||||
| AB-13-106 | Zone 3 | 247.9 | 248.2 | -34 | 313 | 283.29/0.3m CL=0.3m TW, VG | ||||||
| 120.00/0.3m CL=0.3m TW, *CUT | ||||||||||||
| AB-13-151 | New | 80.0 | 81.0 | -47 | 334 | 33.60/1.0m CL=??m TW, VG | ||||||
| Zone 3 | 189.3 | 191.6 | 40.46/2.3m CL=2.2m TW, VG | |||||||||
| AB-13-90 | Zone 3 | 226.1 | 226.6 | -58 | 306 | 0.51/0.5m CL=??m TW | ||||||
| AB-13-92 | Zone 3 | 198.2 | 198.5 | -42 | 305 | 5.90/0.3m CL=??m TW | ||||||
| AB-13-97 | Zone 3 | 293.5 | 293.8 | -64 | 323 | 7.03/0.3m CL=??m TW | ||||||
| AB-13-98 | Zone 3 | 279.0 | 279.3 | -57 | 324 | 7.54/0.3m CL=??m TW | ||||||
| AB-13-103 | Zone 3 | 311.2 | 311.5 | -71 | 315 | 15.02/0.3m CL=??m TW | ||||||
| AB-13-107 | Zone 3 | 283.7 | 284.0 | -56 | 310 | 5.14/0.3m CL=??m TW | ||||||
| AB-13-109 | Zone 3 | 263.2 | 263.5 | -53 | 326 | 3.77/0.3m CL=??m TW | ||||||
| AB-13-110 | Zone 3 | -43 | 327 | NSV | ||||||||
| New | 258.6 | 258.9 | 29.83/0.3m CL=??m TW | |||||||||
| AB-13-123 | -80 | 327 | NSV | |||||||||
| AB-13-124 | New | 285.9 | 286.2 | -65 | 331 | 55.89/0.3m CL=??m TW, VG | ||||||
| Zone 3 | 297.3 | 297.6 | 19.20/0.3m CL=0.3m TW | |||||||||
| AB-13-125 | Zone 3 | -69 | 308 | NSV | ||||||||
| AB-13-137 | Zone 3 | 284.7 | 285.2 | -62 | 327 | 15.77/0.5m CL=0.5m TW, VG | ||||||
| AB-13-138 | New | 314.9 | 315.5 | -70 | 304 | 8.57/0.6m CL=??m TW | ||||||
| Zone 3 | NSV | |||||||||||
| AB-13-139 | Zone 3 | 318.8 | 319.2 | -71 | 335 | 5.14/0.4m CL=??m TW | ||||||
| AB-13-144A | Zone 3 | -70 | 309 | NSV | ||||||||
| AB-13-145 | Zone 3 | 310.7 | 311.4 | -69 | 333 | 9.26/0.7m CL=0.6m TW | ||||||
| AB-13-152A | Zone 3 | -58 | 347 | NSV | ||||||||
| AB-13-153 | Zone 3 | -45 | 343 | NSV | ||||||||
| AB-13-154A | Zone 3 | 198.2 | 198.5 | -47 | 353 | 98.06/0.3m CL=??m TW, VG | ||||||
| AB-13-155 | Zone 3 | -45 | 356 | NSV | ||||||||
| AB-13-156 | Zone 3 | 196.9 | 197.3 | -40 | 319 | 18.86/0.4m CL=0.4m TW, VG | ||||||
| AB-13-162 | New | 70.3 | 70.7 | -52 | 320 | 64.11/0.5m CL=??m TW, VG | ||||||
| Zone 3 | 201.0 | 201.4 | 39.77/0.4m CL=0.3m TW, VG | |||||||||
| AB-13-166 | Zone 3 | 194.2 | 195.1 | -44 | 325 | 41.49/0.9m CL=0.9m TW, VG | ||||||
| AB-13-167 | Zone 3 | 210.2 | 211.7 | -39 | 306 | 35.66/1.5m CL=1.5m TW, VG | ||||||
| AB-13-168 | Zone 3 | 211.1 | 211.4 | -58 | 315 | 54.17/0.3m CL=0.3m TW, VG | ||||||
| AB-13-170 | New | 213.3 | 213.6 | -66 | 316 | 37.03/0.3m CL=??m TW | ||||||
| Zone 2 | 232.9 | 233.2 | 6.21/0.3m CL=??m TW | |||||||||
| AB-13-171A | Zone 3 | 213.9 | 214.2 | -51 | 001 | 76.80/0.3m CL=0.3m TW, VG | ||||||
| AB-13-172 | New | 82.3 | 82.6 | -47 | 323 | 42.69/0.3m CL=??m TW, VG | ||||||
| Zone 3 | 204.4 | 204.8 | 116.23/0.5m CL=0.5m TW, VG | |||||||||
| AB-13-173 | New | 177.3 | 177.8 | -53 | 327 | 34.97/0.4m CL=??m TW, VG | ||||||
| Zone 3 | 217.3 | 218.2 | 3.77/0.9m CL=??m TW |
TW = True Width, CL = Core Length, VG = Visible Gold, ?? TW = True Width Unknown, NSV=No Significant Values *Cut = cut to 120.0 grams/tonne
About the Company
Kirkland Lake Gold Inc.’s corporate goal is to create a self -sustaining and long lived intermediate gold mining company based in the historic Kirkland Lake Gold Camp. The Company plans to do this by mining to the reserve grade, generating profits and free cash flow for the shareholders. The Company will also look to take advantage of its increased infrastructure capacity in the appropriate gold price environment. At the same time, the Company is committed to maintaining a significant exploration program aimed at developing and maintaining a property wide reserve and resource base sufficient to sustain a mine life of more than ten years.
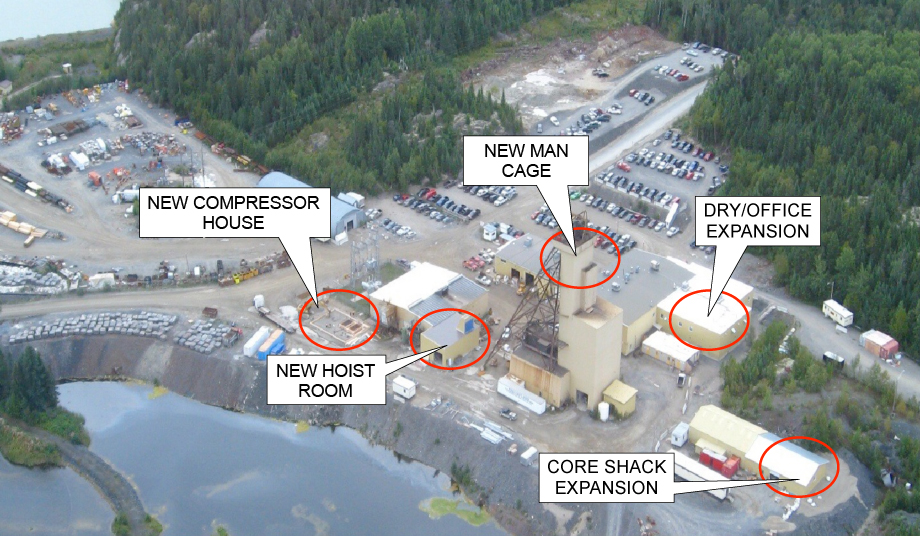
Over the last several years the Company has invested significant capital to improve the infrastructure of the business including upgrading the production hoist, skips, mill, underground mobile equipment and capital development.
[box type=”note” align=”aligncenter” ]
Kirkland has been upgrading its facilities since 2009 in order to accommodate a higher daily throughput of ore. The goal was to reach a daily production level of 2200 tons per day by 2014. Achieving this goal might have been possible if not for the decline in gold prices over the last few years. In the end, the company was thwarted by the need for leaner operations and a higher minimum grade. Still, the equipment upgrades should help the company run more efficiently in the years to come. We have included a photos of the upgrade progress from the company website below.
[/box]
From initial discovery to present day there have been over 24 million ounces of gold mined from the Kirkland Lake camp while the current reserve and resource provides for potentially 10 years of mining with significant exploration upside.
The results of the Company’s underground diamond drilling program have been reviewed, verified (including sampling, analytical and test data) and compiled by the Company’s geological staff (which includes a ‘qualified person’, Stewart Carmichael P.Geo., the Company’s Chief Exploration Geologist, for the purpose of National Instrument 43-101, Standards of Disclosure for Mineral Projects, of the Canadian Securities Administrators). Mr. Carmichael also supervised the preparation of the information that forms the basis of the technical disclosure in this release.
[box type=”note” align=”aligncenter” ]
Lastly, a company’s QA/QC statement (below) is always worth noting whenever results are reported.
[/box]
The Company has implemented a quality assurance and control (QA/QC) program to ensure sampling and analysis of all exploration work is conducted in accordance with the best possible practices. The drill core is sawn in half with one half of the core samples shipped to Swastika Laboratories in Swastika, Ontario. The other half of the core is retained for future assay verification. Other QA/QC includes the insertion of blanks, and the regular re-assaying of pulps and rejects at alternate certified labs. Gold analysis is conducted by fire assay using atomic absorption or gravimetric finish. The laboratory re-assays at least 10% of all samples and additional checks may be run on anomalous values.
[box type=”success” align=”aligncenter” ]Have a company or release you’d like us to look at? Let us know though our contact page, through Google+, Twitter or Facebook.[/box]