One might wonder why Seabridge is not using this year’s drill program to further develop other resources that have been identified. A valid question to be sure, but it’s hard to ignore the higher grades associated with this zone.
[box type=”info” align=”aligncenter” ]Disclaimer: This is an editorial review of a public press release and may include opinions or points of view that may not be shared by the owners of geologyforinvestors.com or the companies mentioned in the release. The editorial comments are highlighted so as to be easily separated from the release text. Please view the full release here.[/box]
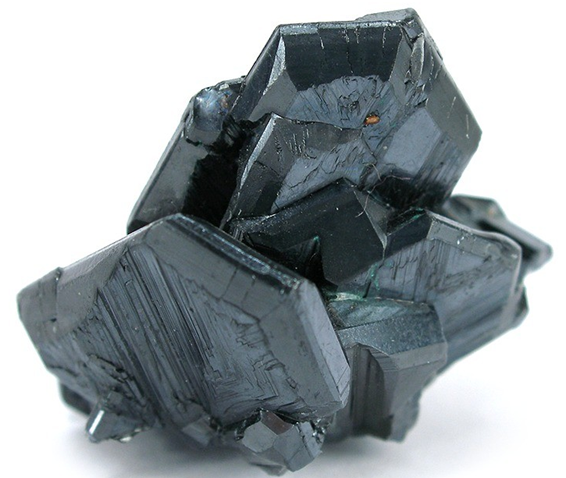
TORONTO, CANADA–(Marketwired – Sept. 10, 2013) – Seabridge Gold (TSX:SEA)(NYSE:SA) announced today that new drilling has found an exceptional bornite-rich zone within the higher-grade Deep Kerr core zone on its 100% owned KSM project in north western British Columbia, Canada. Bornite is a copper mineral generally formed at higher temperatures within a core zone and is typically found in larger, higher-grade copper deposits.
[box type=”note” align=”aligncenter” ]Read more about the KSM Project here.[/box]
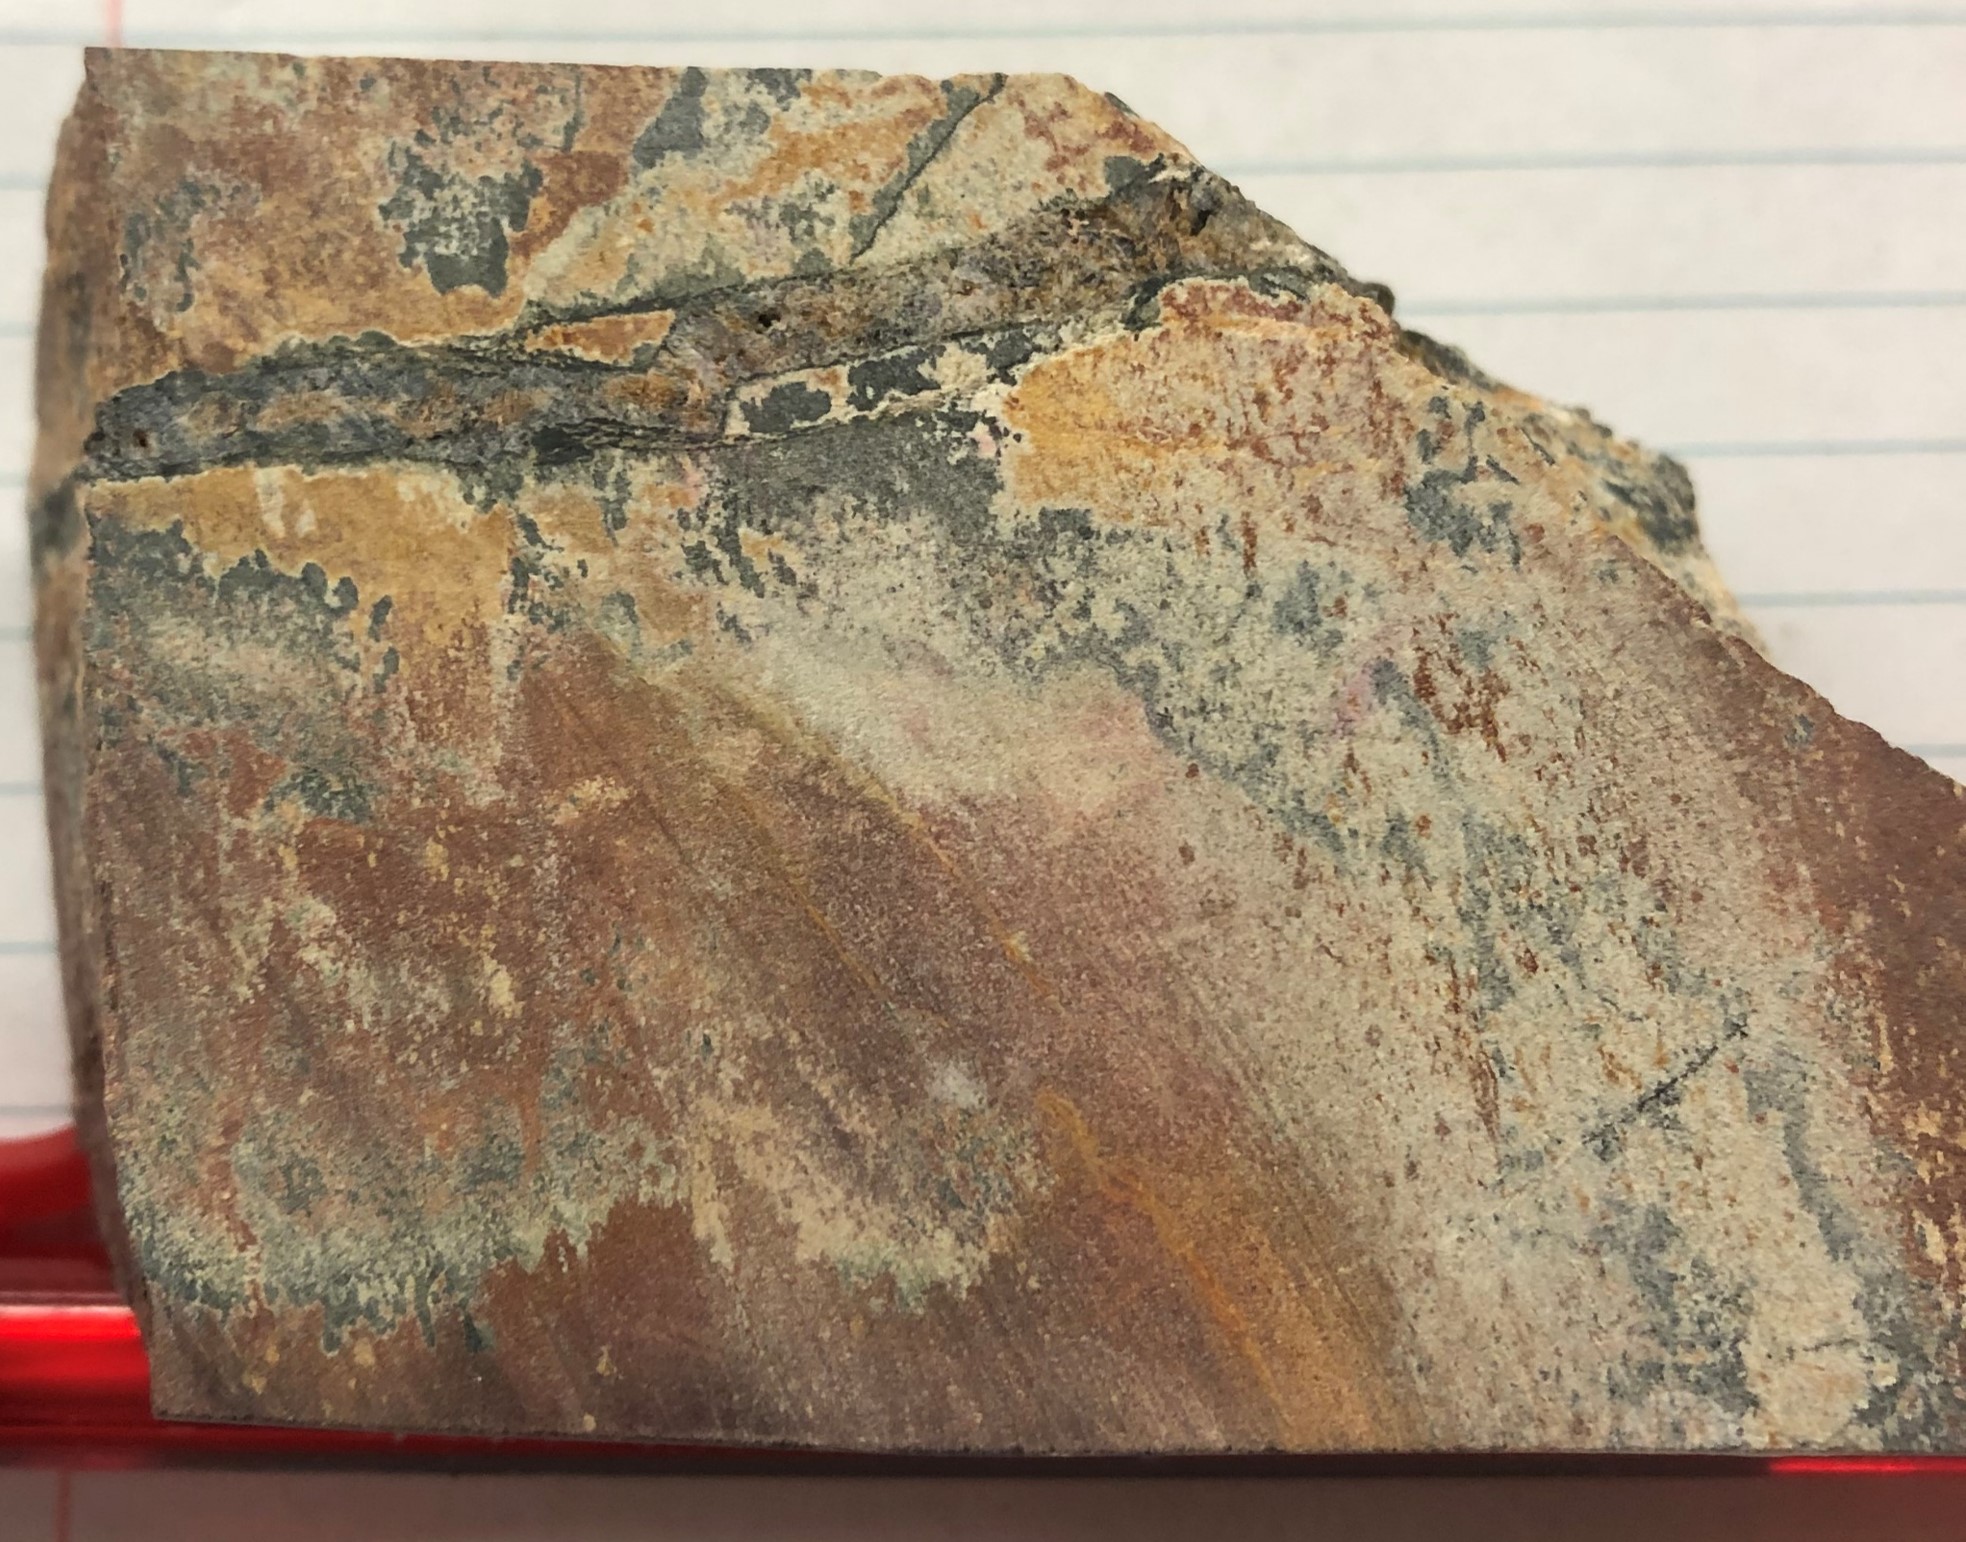
As announced on August 12, 2013, Seabridge has discovered a higher-grade copper-gold core zone named Deep Kerr which lies beneath the Kerr porphyry deposit. Wide-spaced drilling has established that Deep Kerr is at least 1600 meters long and remains open to the north and at depth. The mineralized envelope thus far is up to 300 meters in width consisting primarily of chalcopyrite (a copper mineral) and gold. Within this envelope, wide bornite-rich intervals have now been intersected in stockwork veins with abundant chalcopyrite and other minor copper minerals as well as high gold values. The first of these bornite intercepts to be assayed contains the highest grade copper mineralization ever drilled at KSM. Wall rock in these intervals is intensely altered; the style of alteration and mineralization are characteristic of a deep, high temperature core zone targeted by Seabridge in this year’s program.
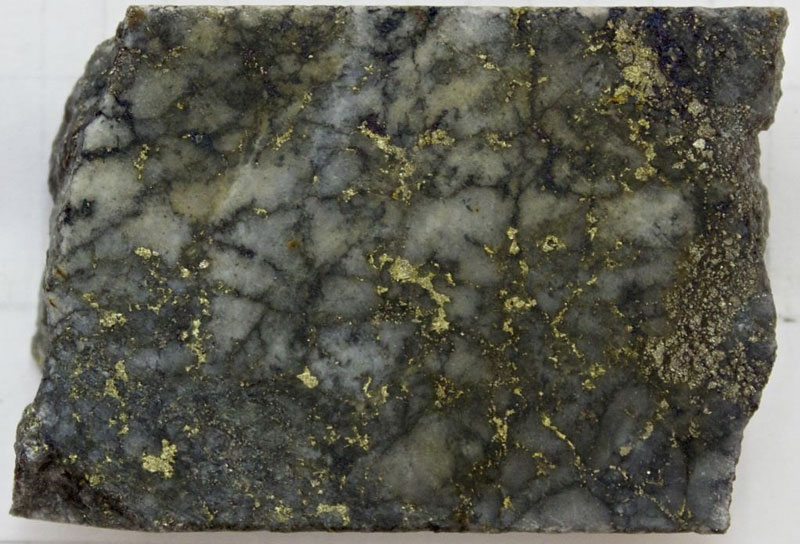
[box type=”note” align=”aligncenter” ]We’ve included a photo sample of the rock in question. Bornite is a copper-rich sulfide with 63% copper by weight. Compare that to chalcopyrite which is about 35% copper. Bornite is associated with higher temperatures and with higher gold contents in porphyry copper-gold deposits, whereas chalcopyrite and pyrite are associated with lower temperatures. Magnetite may also be associated with these high temperature assemblages and geophysical surveys may help delineate them.[/box]
Seabridge Chairman and CEO Rudi Fronk noted that “the discovery of abundant bornite was near the top of this year’s exploration wish list because it typically brings higher grades of both copper and gold. We are now focused on expanding the bornite zone and finding where its expression is strongest. We are gratified to see that the bornite zone appears at moderate depths within Deep Kerr, indicating that this material could be accessed from the valley floor,” Fronk said.
“Drilling at Deep Kerr is continuing on schedule with five core rigs. This is a very large target. Drill hole locations are therefore being confined to a thousand meters of strike length to facilitate an initial resource estimate later this year. An assessment of the overall size of Deep Kerr will need to wait for next year. A sixth core rig has been added to the current program and is now at Iron Cap where the first three holes that we drilled this year indicate the potential for another high-grade core zone discovery.” (See August 20, 2013 news release on Iron Cap).
Assay results from the next five core holes drilled at Deep Kerr this year are as follows:
| Hole ID | Total Depth (meters) | From (meters) |
To (meters) |
Thickness (meters) | Gold Grade (g/T) | Copper Grade (%) |
Silver Grade (g/T) |
| K-13-23A | 1368 | 823.4 | 1007.8 | 184.4 | 0.21 | 0.56 | 2.11 |
| K-13-24A | 1206 | 791.0 | 952.0 | 161.0 | 0.38 | 0.51 | 1.97 |
| 1080.4 | 1139.6 | 59.2 | 0.26 | 0.62 | 1.26 | ||
| K-13-24B | 1155 | 762.0 | 931.0 | 169.0 | 0.50 | 0.59 | 2.34 |
| 1027 | 1102 | 75 | 0.41 | 0.57 | 1.22 | ||
| K-13-28 | 1340 | 710.0 | 739.1 | 29.1 | 2.04 | 0.60 | 11.63 |
| 904.0 | 1012.4 | 108.4 | 0.59 | 0.75 | 3.23 | ||
| K-13-29 | 993 | 572.4 | 810.4 | 238.0 | 0.55 | 0.89 | 1.39 |
| including | 641.7 | 710.4 | 68.7 | 1.14 | 1.78 | 2.06 |
[box type=”note” align=”aligncenter” ]One might wonder why Seabridge is not using this year’s drill program to further develop other resources that have been identified. A valid question to be sure, but it’s hard to ignore the higher grades associated with this zone. In a depressed investment market such as this one, news has to be really good to make a company pop.[/box]
2013 drilling at Deep Kerr is employing state-of-the-art directional drilling tools that enable a process known as wedging, in which additional holes are started part way down a previously drilled hole. The directional tools ensure that the new hole deviates from the first in a predictable manner so as to provide another intercept of the target at least 75 meters from the original intercept, thereby generating new information to be used in calculating an initial resource estimate for Deep Kerr. This technology significantly reduces the amount of drilling required to achieve a new intercept of the target zone as the top 500 to 800 meters of the hole does not have to be redrilled. The above reported drill holes with a letter designation after the hole number represent wedged drill holes completed from holes that have been previously reported (i.e. K-13-23 and K-13-24). Drill hole K-13-23A wedged from K-13-23 at 547 meters. Hole K-13-24A was wedged at 608 meters and K-24-B at 524 meters from K-13-24.
[box type=”note” align=”aligncenter” ]Seabridge is using a fairly advanced diamond drilling technique – something you don’t see a lot of with the juniors. Essentially this allows them to branch out once they reach a pre-drilled target depth.[/box]
The above reported drill holes were designed to intersect mineralized zones as close as technically feasible to a perpendicular angle to their strike. Therefore, the true widths of this mineralization are believed to be at least 75% of the reported intercepts.
[box type=”note” align=”aligncenter” ]The temptation with a directional drilling approach would be to follow the high grade zone – which might be very narrow – resulting in an inaccurate picture of its true size. Basically what they are saying is that they are they’re trying to accurately define the zone, but essentially they don’t know. We’ve talked about this one before: Read about apparent width versus true width. [/box]
The KSM Project contains one of the largest undeveloped gold and copper reserves in the world. Its composite intrusive complex hosts four large gold-copper porphyry deposits with direct genetic links to epithermal vein deposits including the neighboring Brucejack/Valley of the Kings development owned by Pretium Resources. The KSM mining district has undergone enormous deformation as the rocks that host its deposits were welded onto the North American continent. As a consequence of this deformation, many of the original geometric arrangements and mineralogical cues common in porphyry systems have been significantly modified and obscured. Seabridge is now unravelling the complex history of the district in order to discover the magmatic sources of its huge mineralizing systems.
[box type=”note” align=”aligncenter” ]If you’ve read about other more traditional porphyry copper deposits on our site, you may have noticed that they are generally younger and associated with active volcanic belts. These deposits are old enough to have been heavily altered and deformed, but young enough not to have completely lost their “genetic” relationship to traditional porphyry copper systems.[/box]
Proven and probable reserves at KSM are as follows:
| Average Grades | Contained Metal | ||||||||||
| Project | Zone | Reserve Category |
Tonnes (millions) |
Gold (gpt) | Copper (%) |
Silver (gpt) |
Moly (ppm) |
Gold (million ounces) |
Copper (million pounds) |
Silver (million ounces) |
Moly (million pounds) |
| KSM | Mitchell | Proven | 476 | 0.67 | 0.17 | 3.05 | 60.9 | 10.3 | 1,798 | 47 | 64 |
| Probable | 935 | 0.57 | 0.16 | 3.11 | 50.7 | 17.2 | 3,296 | 93 | 104 | ||
| Iron Cap | Probable | 193 | 0.45 | 0.20 | 5.32 | 21.5 | 2.8 | 834 | 33 | 9 | |
| Sulphurets | Probable | 318 | 0.59 | 0.22 | 0.79 | 50.6 | 6.0 | 1,535 | 8 | 35 | |
| Kerr | Probable | 242 | 0.24 | 0.45 | 1.2 | 0.0 | 1.9 | 2,425 | 9 | 0 | |
| KSM Totals | Proven | 476 | 0.67 | 0.17 | 3.05 | 60.9 | 10.3 | 1,798 | 47 | 64 | |
| Probable | 1,688 | 0.51 | 0.22 | 2.65 | 40.1 | 27.9 | 8,090 | 144 | 149 | ||
| Total | 2,164 | 0.55 | 0.21 | 2.74 | 44.7 | 38.2 | 9,888 | 191 | 213 | ||
[box type=”note” align=”aligncenter” ]If you haven’t yet read our article on Reserves vs Resources you can find it here. [/box]
Exploration activities at KSM are being conducted by Seabridge personnel under the supervision of William E. Threlkeld, Senior Vice President of Seabridge and a Qualified Person as defined by National Instrument 43-101. Mr. Threlkeld has reviewed and approved this news release. An ongoing and rigorous quality control/quality assurance protocol is being employed during the 2013 program including blank and reference standards in every batch of assays. Cross-check analyses are being conducted at a second external laboratory on 10% of the samples. Samples are being assayed using fire assay atomic adsorption methods for gold, total digestion ICP methods for other elements, and atomic adsorption methods for Cu, Ag, Mo, Pb, Zn and As on samples with >0.5% Cu, by ALS Minerals Canada Ltd. in North Vancouver, B.C.
[box type=”note” align=”aligncenter” ]A good QA/QC program is critical when analysing geochemical data. Read more here. [/box]
Seabridge holds a 100% interest in several North American gold resource projects. The Company’s principal assets are the KSM property located near Stewart, British Columbia, Canada and the Courageous Lake gold project located in Canada’s Northwest Territories. For a breakdown of Seabridge’s mineral reserves and resources by project and category please visit the Company’s website athttp://www.seabridgegold.net/resources.php.
[toggle title=”We’ve skipped some of the boilerplate. You can read it in here.” state=”close” ]
All reserve and resource estimates reported by the Corporation were calculated in accordance with the Canadian National Instrument 43-101 and the Canadian Institute of Mining and Metallurgy Classification system. These standards differ significantly from the requirements of the U.S. Securities and Exchange Commission. Mineral resources which are not mineral reserves do not have demonstrated economic viability.
This document contains “forward-looking information” within the meaning of Canadian securities legislation and “forward-looking statements” within the meaning of the United States Private Securities Litigation Reform Act of 1995. This information and these statements, referred to herein as “forward-looking statements” are made as of the date of this document. Forward-looking statements relate to future events or future performance and reflect current estimates, predictions, expectations or beliefs regarding future events and include, but are not limited to, statements with respect to: (i) the core zone being readily accessible from the valley floor; (ii) the potential for another core zone below the Iron Cap deposit; (iii) the generation of a resource estimate for the deposit later this year; (iv) the proximity of the intercepts to true widths; (v) the estimated amount and grade of mineral reserves and mineral resources; (vi) estimates of capital costs of constructing mine facilities and bringing a mine into production, including financing payback periods; (vii) the amount of future production; and (vii) estimates of operating costs, net cash flow and economic returns from an operating mine. Any statements that express or involve discussions with respect to predictions, expectations, beliefs, plans, projections, objectives or future events or performance (often, but not always, using words or phrases such as “expects”, “anticipates”, “plans”, “projects”, “estimates”, “envisages”, “assumes”, “intends”, “strategy”, “goals”, “objectives” or variations thereof or stating that certain actions, events or results “may”, “could”, “would”, “might” or “will” be taken, occur or be achieved, or the negative of any of these terms and similar expressions) are not statements of historical fact and may be forward-looking statements.
All forward-looking statements are based on Seabridge’s or its consultants’ current beliefs as well as various assumptions made by them and information currently available to them. These assumptions include: (i) the presence of and continuity of metals at the Project at modeled grades; (ii) the capacities of various machinery and equipment; (iii) the availability of personnel, machinery and equipment at estimated prices; (iv) exchange rates; (v) metals sales prices; (vi) appropriate discount rates; (vii) tax rates and royalty rates applicable to the proposed mining operation; (viii) financing structure and costs; (ix) anticipated mining losses and dilution; (x) metallurgical performance; (xi) reasonable contingency requirements; (xii) success in realizing proposed operations; (xiii) receipt of regulatory approvals on acceptable terms, including the necessary right of way for the proposed tunnels; and (xiv) the negotiation of satisfactory terms with impacted Treaty and First Nations groups. Although management considers these assumptions to be reasonable based on information currently available to it, they may prove to be incorrect. Many forward-looking statements are made assuming the correctness of other forward looking statements, such as statements of net present value and internal rates of return, which are based on most of the other forward-looking statements and assumptions herein. The cost information is also prepared using current values, but the time for incurring the costs will be in the future and it is assumed costs will remain stable over the relevant period.
By their very nature, forward-looking statements involve inherent risks and uncertainties, both general and specific, and risks exist that estimates, forecasts, projections and other forward-looking statements will not be achieved or that assumptions do not reflect future experience. We caution readers not to place undue reliance on these forward-looking statements as a number of important factors could cause the actual outcomes to differ materially from the beliefs, plans, objectives, expectations, anticipations, estimates assumptions and intentions expressed in such forward-looking statements. These risk factors may be generally stated as the risk that the assumptions and estimates expressed above do not occur, but specifically include, without limitation: risks relating to variations in the mineral content within the material identified as mineral reserves or mineral resources from that predicted; variations in rates of recovery and extraction; developments in world metals markets; risks relating to fluctuations in the Canadian dollar relative to the US dollar; increases in the estimated capital and operating costs or unanticipated costs; difficulties attracting the necessary work force; increases in financing costs or adverse changes to the terms of available financing, if any; tax rates or royalties being greater than assumed; changes in development or mining plans due to changes in logistical, technical or other factors; changes in project parameters as plans continue to be refined; risks relating to receipt of regulatory approvals or settlement of an agreement with impacted First Nations groups; the effects of competition in the markets in which Seabridge operates; operational and infrastructure risks and the additional risks described in Seabridge’s Annual Information Form filed with SEDAR in Canada (available at www.sedar.com) for the year ended December 31, 2012 and in the Corporation’s Annual Report Form 40-F filed with the U.S. Securities and Exchange Commission on EDGAR (available at www.sec.gov/edgar.shtml). Seabridge cautions that the foregoing list of factors that may affect future results is not exhaustive.
When relying on our forward-looking statements to make decisions with respect to Seabridge, investors and others should carefully consider the foregoing factors and other uncertainties and potential events. Seabridge does not undertake to update any forward-looking statement, whether written or oral, that may be made from time to time by Seabridge or on our behalf, except as required by law.
ON BEHALF OF THE BOARD
Rudi Fronk, Chairman and CEO
[/toggle]
[box type=”success” align=”aligncenter” ]Have a company or release you’d like us to look at? Let us know though our contact page, through Google+, Twitter or Facebook.[/box]