Geophysical methods are particularly useful in diamond exploration. They tend to work well because kimberlite pipes, the diamond hosting rock, generally have properties that are different from the surrounding rock. In addition, the data provide most of the guidance on where to position drillholes. On a property-wide scale airborne surveys will be used to cover large swaths of land. On a local scale, ground surveys are used to site and orient a drill hole. Together these surveys are used to assess the target’s size and to model the anomalies at depth.
The location of airborne surveys are usually dictated by positive mineral chemistry results obtained from previous soil sampling programs. The airborne data is then used in combination with the soil chemistry results to select and prioritize targets for follow-up ground work. That groundwork may include prospecting for kimberlite float (loose pieces of rock at surface) or, if a sufficiently favorable targets exist, more detailed ground geophysical surveys over the anomalies. The airborne data provides important information for the structural and geological interpretation of the area is. Airborne datasets also contain digital terrain information useful for correlating with selected anomalies. For example, a magnetic anomaly coinciding with a topographic depression would be a good kimberlite target if the kimberlite rock is expected to be softer than the host rock.
The main methods used in diamond exploration are listed below. Each method targets a specific physical property by measuring a parameter.
| Method | Physical Property | Parameter |
| Magnetic | Magnetic susceptiblity and remanence | Spatial variations in the strength of the Earth’s magnetic field |
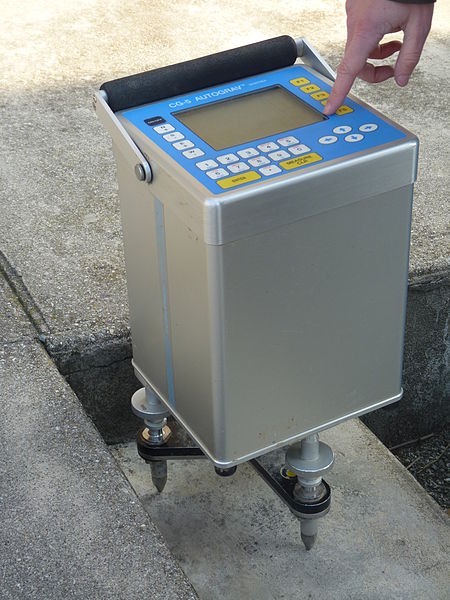
| Gravity | Density | Spatial variations in the strength of the gravitational field of the Earth |
| Electromagnetic | Electrical conductivity and Inductance | Response to Electromagnetic Radiation |
| Radar | Dielectric constant | Travel times of reflected radar pulses |
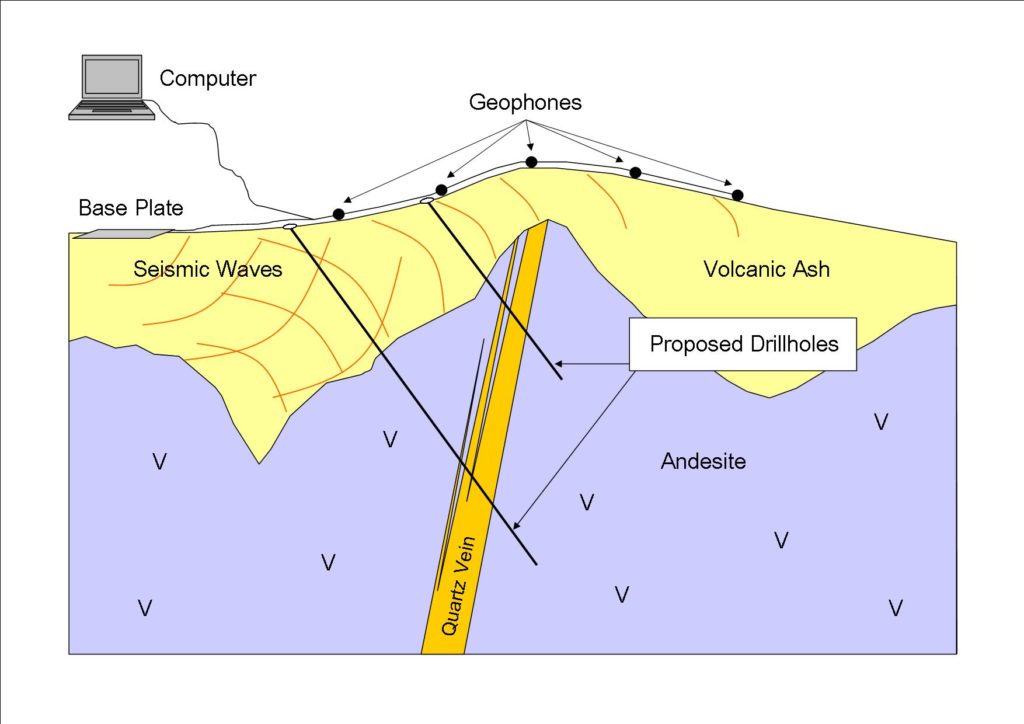
| Seismic | Density and elastic moduli, used to determine the travel speed of seismic waves | Travel times of reflected/refracted seismic waves |
The main criteria generally considered by the exploration team when deciding on the type of survey to conduct are:
The physical property contrast
Choosing the correct survey method to use depends on the possible physical property contrast between the target (kimberlite diatreme) and the host rock. If little contrast exists between the host rock and the kimberlite pipe it will be very difficult to detect the kimberlites using the given method.
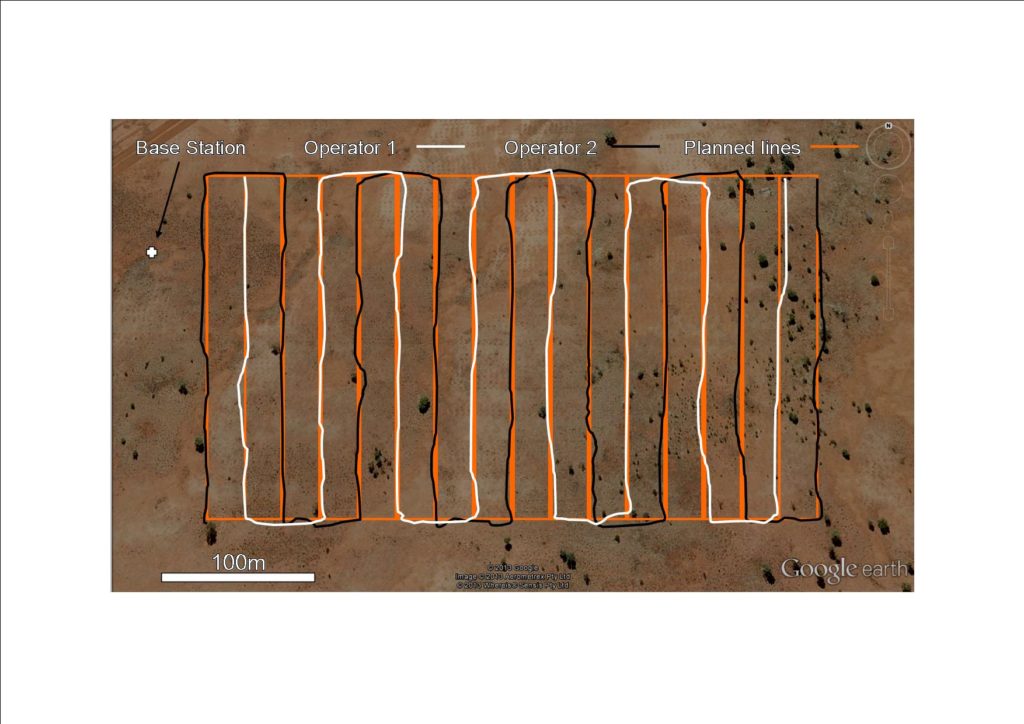
Line separation
The resolution of the geophysical map produced for interpretation is linked to the line separation. Choosing a practical line separation is a balance between an understanding of the possible target sizes, the complexity of the geology as a function of the specific parameter being measured, and the costs of the survey. If the line spacing is too wide for the target there is a good chance that the target will be missed or that the target will only have one line going through it; typically one needs at least two lines to be able to select a target somewhat confidently. Selecting targets from one line might result in too few or too many targets being selected. If the geological background is very complex relative to the target size and the line spacing is too wide it will be difficult to interpret the geophysical data at a level sufficient for the selection of targets. If the line spacing is lower than necessary it will have a significant effect on the cost of the survey and the duration of the survey.

The survey line direction
The line direction should be chosen to criss-cross the dominant geological structures in the area. Otherwise, the geophysical data could miss important structures or lead to artifacts in geophysical maps.
The overall cost
Generally surveys are costed at a per line-kilometer (lkm) or per station reading rate. The rates can vary from $10/lkm to well over $120/lkm depending on the type of survey, the size of the survey, the difficulty of surveying the given terrain, the number of parameters measured, and the amount of processing required for example. It’s not uncommon for a junior explorer to have to budget between $300,000 to over $1 million a survey without considering fuel costs, crew accommodations and mobilization costs to and from the survey site. A poorly designed survey not only costs money but it leads to compounding negative effects on the selection of targets to drill, the expected discoveries, and potentially a lost mining investment opportunity.
A Multi-method Approach
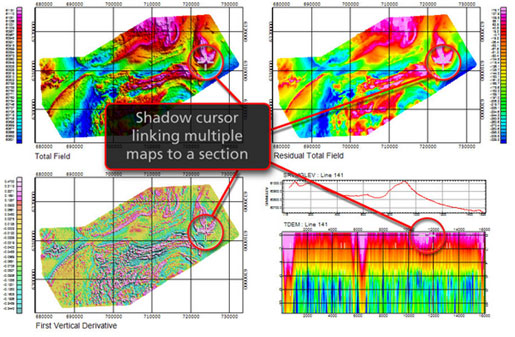
Geophysical anomalies are usually selected by a trained geophysicist using many datasets together. For example, one anomaly may be the result of selecting targets from various geophysical “products” obtained from one or more surveys. These products may include a digital elevation map, airborne and ground magnetic maps, line-by-line magnetic profiles, gravity and electromagnetic data as well as depth-modeling of the data to get an idea of the possible target shape. All of this data would be unnecessarily complicated to show in a news release or company website, and what we usually sees is the most effective single product that conveys the idea of an anomaly. This product tends to be a magnetic, gravity, and/or sometimes a conductivity map. However, it’s useful to remember that these maps are interpretations generated with the aid of gridding algorithms. This is to say that the real data only exists where the measurement was taken (e.g. on a survey line given a magnetic survey) and the gridding interpretation is done by an imaging algorithm between the lines of a survey.
Traditionally magnetics have been the best and most economical survey method to use in kimberlite exploration. Magnetic data are collected continuously by a magnetometer located on a fixed wing or helicopter platform and the data are used to select anomalies. Those anomalies are then resurveyed from the ground at a smaller line spacing.
Other survey methods that work well, depending on the environment are gravity and electromagnetics. Electromagnetic surveys work well where the exploration team expects either a more conductive “cap” (the weathered material usually forming the top few meters of a kimberlite), or the kimberlite is expected to be more resistive than the background rock at depth. Electromagnetic sensors are often placed on the same airborne platform as a magnetometer to reduce costs significantly while significantly increasing the ability to detect anomalies.

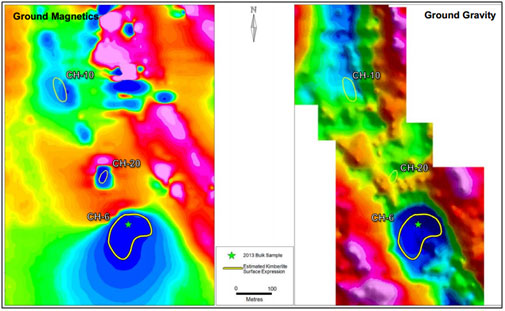
The gravity method also works well since kimberlite typically has a specific gravity that is lower than older Archean basement rock and this produces a gravity low response. However, in sedimentary basins kimberlite may have a gravity high response if the background rock has lower density. However, gravity surveys can be time consuming and expensive because the measurements require more time and more equipment. Gravity methods may be extremely good at finding kimberlites given the right conditions but they are extremely sensitive to any type of perturbation. When choosing to do a gravity survey at the exploration level one is generally expecting to find kimberlites that have no discernible magnetic or electromagnetic response. Again, the expected contrast should be the driver behind the choice in survey method. Often, airborne survey platforms will combine instruments for various methods to reduce costs.
Seismic and Radar methods have proven useful when more detailed structural information about a known kimberlite is needed. These are not exploration methods generally used to discover an unknown kimberlite because they tend to be more expensive compared to the other methods mentioned.
Gradient magnetic surveys are also common. Magnetic gradients are measured using at least two sensors, separated by a distance. The difference in measurements between the sensors is used with the separation distance to produce a gradient value at a location between the two sensors. These methods can contribute to a significant reduction in survey costs by allowing a larger line separation or increasing the capacity to detect targets from one survey line.
Lastly, gradiometer gravity surveys represent some of the most advanced technologies in geophysical surveying. Full tensor gravity gradiometers measure the rate of change of gravitational acceleration along three perpendicular directions at the same time (for example: up-down, east-west, and north-south). The detection ability of these systems is greatly affected by the survey sensor altitude and speed. Ultimately, the explorer must understand the detection capability of the system(s) used with respect to the target sought. A full discussion of this method is beyond the scope of this article, but a technical reference is included below.
Further Reading
Dransfield, M. and Christensen, A. (2013). ”Performance of airborne gravity gradiometers.” The Leading Edge,32(8), 908–922. (Academic article)
Subscribe for Email Updates