
Gravity Surveys – The Basics
Gravity surveys measure minute variations in gravity. Gravity at every point on the surface of the earth varies slightly depending on:
- distance from the equator, or
- density of the underlying rocks.
The ability for rock density to be detected using gravity variations is the basis for the use of Gravity Surveys in mineral exploration.
A gravity survey is designed to pick up density variations below the surface.
If the earth was a perfect sphere and was composed of the same material throughout, gravity would be the same anywhere on the surface. However because the planet is slightly squashed, gravity at the poles is slightly higher than at the equator due to the slightly shorter distance to the centre of the earth at the poles.
The ability for rock density to be detected using gravity variations is the basis for the use of Gravity Surveys in mineral exploration.
Rock below the earth’s surface is not homogeneous. It is composed of material of different densities, both horizontally and vertically. The density of rock varies with the amount of mass contained within them. Denser rocks contain more mass and therefore exert a greater force of gravitational attraction.
Rock density varies with different mineral compositions and the amount of pore space between the individual mineral grains. Metals tend to be denser than surrounding rocks, meaning that a gravity anomaly may pick up a mineral concentration that is otherwise invisible to other geological exploration methods.
Gavity Anomailies In Detail
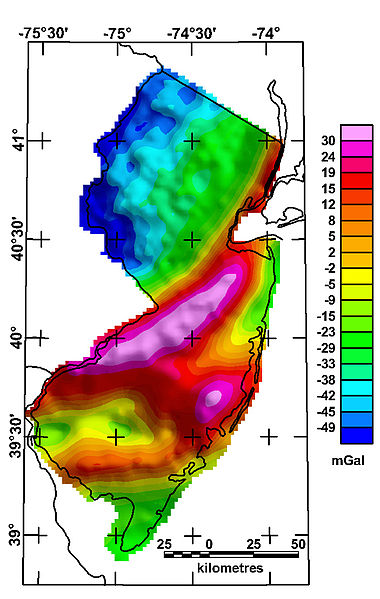
Gravity anomalies come in all sorts of shapes and sizes. Positive gravity anomalies are produced by regions of higher than average density. Lower than average density regions produce negative anomalies. The areal extent of an anomaly defines the lateral extent of the body producing the anomaly. A sharp, short wavelength anomaly indicates a shallow, dense object. A broad long wavelength anomaly points to the presence of a deeply buried massive body.
Variations such as these provide an insight into different rock types and geological structures that are otherwise hidden. Three examples of the gravitational response above different rock types and structures are given below.
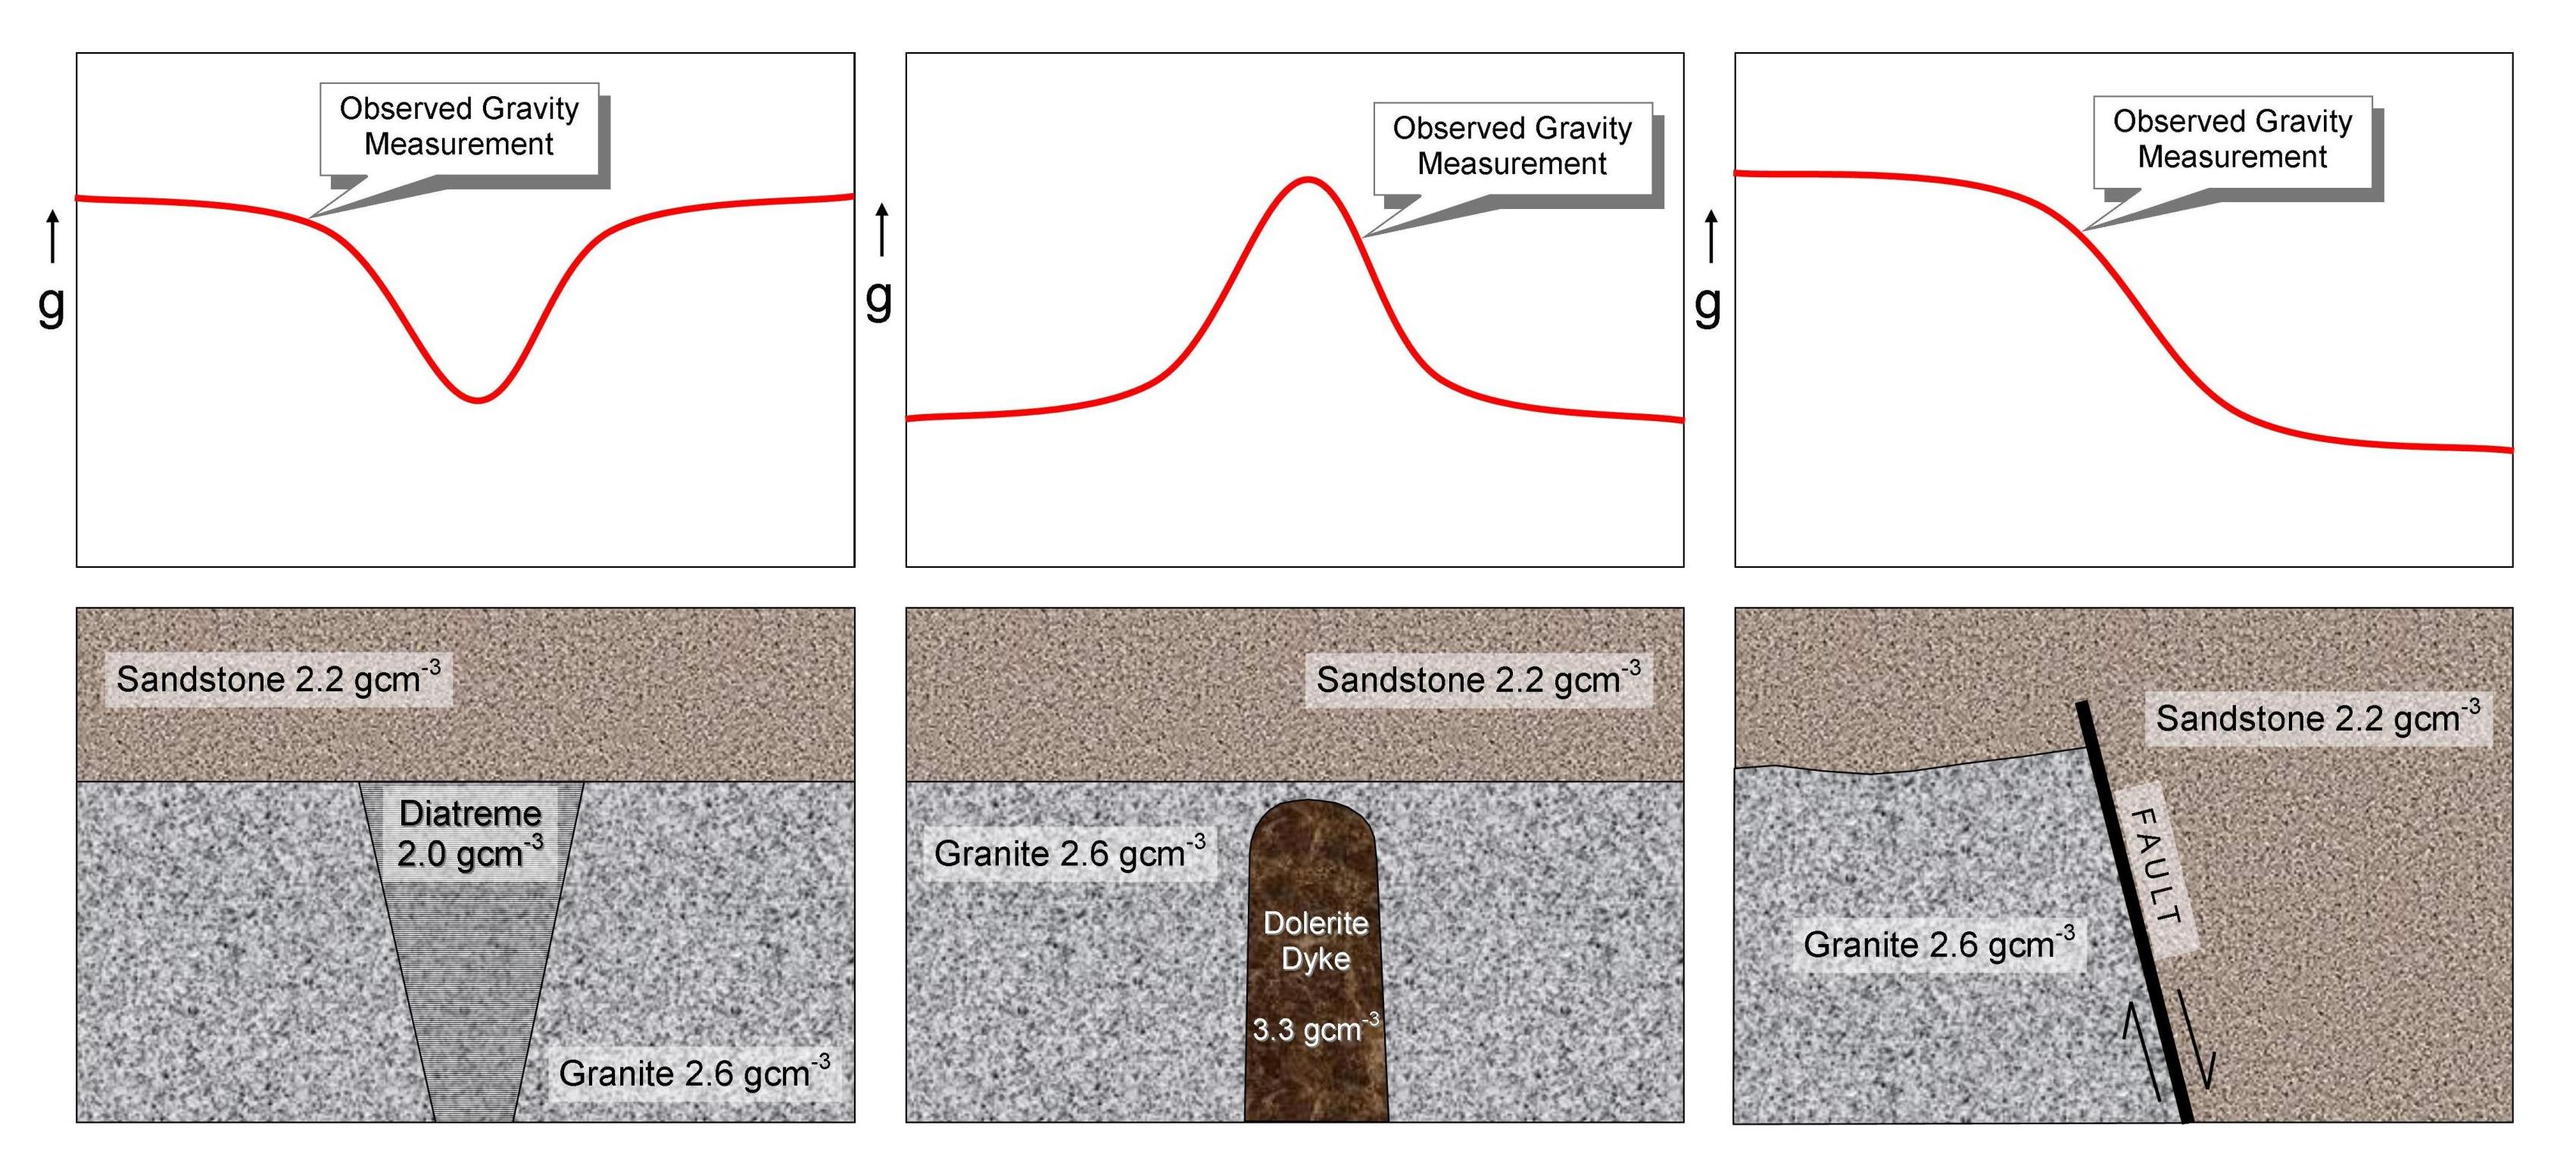
Gravity Anomaly #1 – Diatreme
The first example is a diatreme where granite has been broken up and redeposited within a volcanic vent. A reduction in density has occurred due to an increase in porosity. Although a sandstone layer covers the diatreme it is detectable by the gravity survey method because a mass deficit exists. A negative gravity anomaly is the result.
Gravity Anomaly #2 – Dyke
The next example shown is a dolerite dyke intruding granite. Both rocks have virtually the same porosity so this is not the cause for the different densities. The mineral composition of the dyke means it a much denser than the granite. Again, the overlying sandstone unit is no barrier to the gravity survey method. Due to the extra mass associated with the dyke, a positive gravity anomaly is recorded in the survey results
Gravity Anomaly #3 – Hidden Fault
Faults can also be detected by the gravity surveys. Granite has been brought next to sandstone because of fault action. Later, a sandstone layer has covered the fault however the structure is still detectable by the gravity survey method because of the mass differences immediately below the sandstone layer. Granite has a higher density than sandstone and therefore contains more mass than the sandstone in a given volume. A positive response occurs over the granite while a negative response occurs over the sandstone.
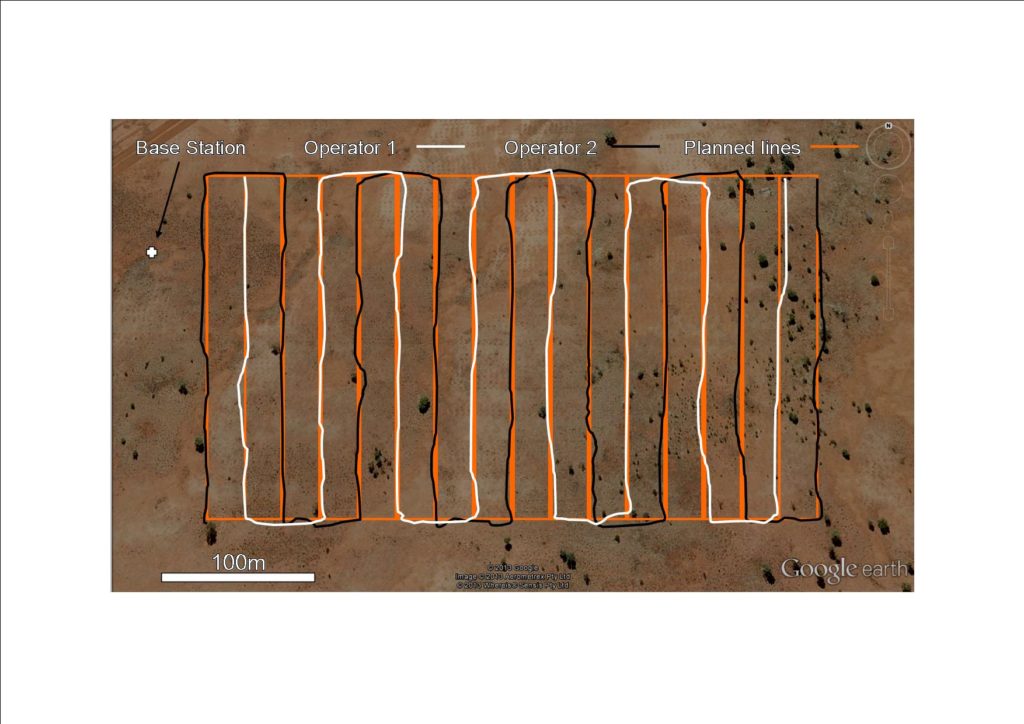
How Is A Gravity Survey Done?
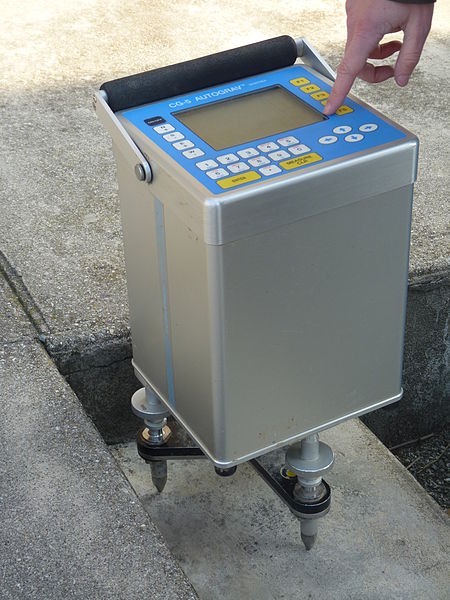
Gravity surveys can be can be either aerial, ship-based or land-based. On land, surveys use four wheel drive vehicles and quad bikes. The gravity meter or gravimeter is a very delicate instrument. It is highly sensitive and great care is required, as the unit is easily damaged by vibrations and shocks in transit. Minor vibrations may also affect the readings as they are being taken at each locality.
Once the gravity measurements have been collected data are processed by the geophysicist. The data is then plotted as a computer-generated map. The geophysical anomalies mapped are then studied by the geologist who overlays geochemical and other geophysical data. The geologist looks for coincident anomalies which can then be followed up with field work and drilling.
Iron oxide-copper-gold (IOCG) deposits can be identified quite successfully using the gravity survey method. These deposits give a strong positive gravity anomaly due to the abundance of hematite, an iron oxide mineral, which is much denser than the surrounding non-mineralised rock. Due to strong alteration of magnetite to hematite within the mineralising system a magnetic low is often produced. The combination of a gravity high and a magnetic low anomalies is good evidence for a hidden copper-rich IOCG deposit.
Exploration for volcanic massive sulphide (VMS) and Mississippi Valley-type deposits can also make use of gravity surveys due to the contrast between the host rock and the deposit-related sulfides.
